Technical Analysis of CMA 2024-05-10
Overview:
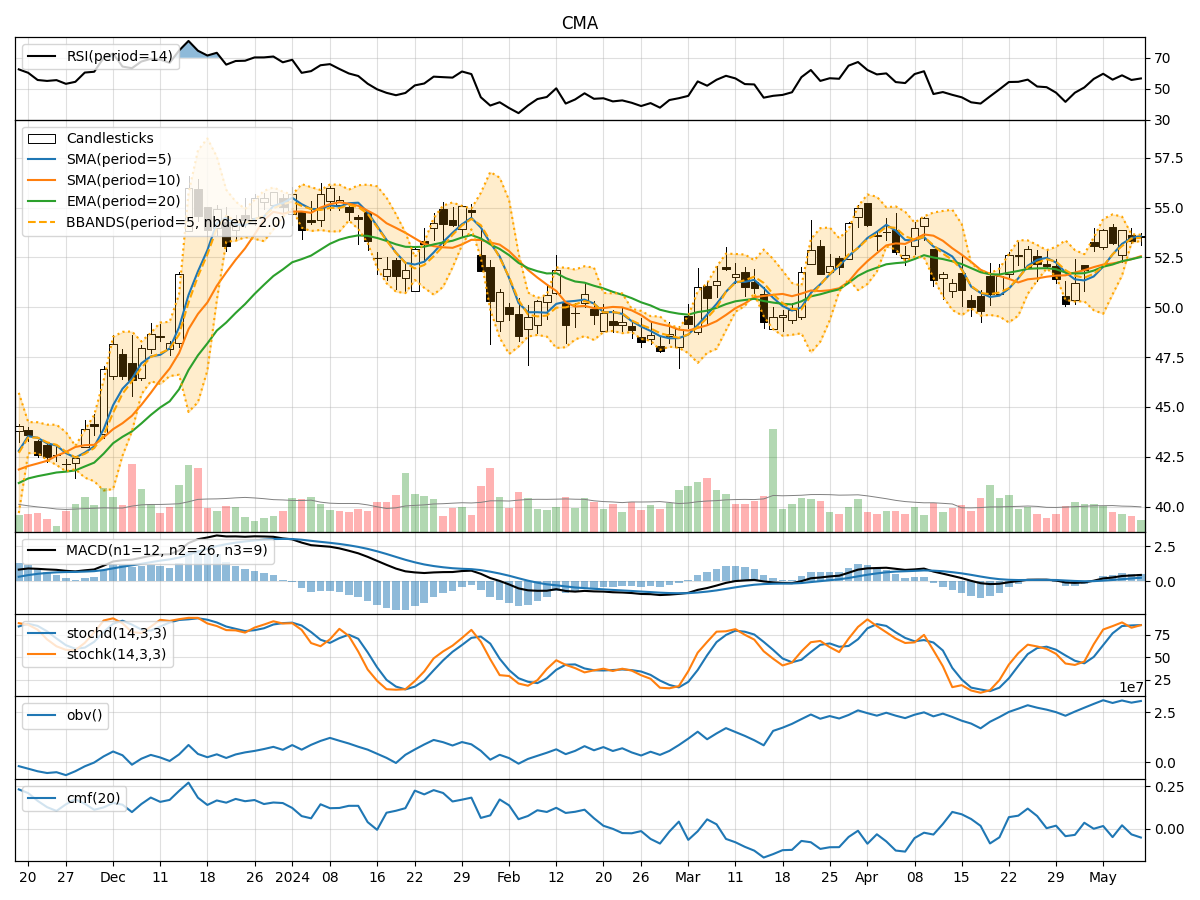
In analyzing the technical indicators for CMA over the last 5 days, we will delve into the trend, momentum, volatility, and volume indicators to provide a comprehensive outlook on the possible stock price movement. By examining these key aspects, we aim to offer valuable insights and predictions for the upcoming days.
Trend Analysis:
- Moving Averages (MA): The 5-day MA has been consistently above the closing prices, indicating a bullish trend.
- MACD: The MACD and signal line have been trending upwards, with the MACD histogram also showing positive values, suggesting bullish momentum.
Momentum Analysis:
- RSI: The RSI has been fluctuating around the 50 level, indicating a neutral momentum.
- Stochastic Oscillator: Both %K and %D have been in the overbought zone, suggesting a potential reversal or consolidation.
Volatility Analysis:
- Bollinger Bands (BB): The stock price has been trading within the bands, with the %B indicator hovering around the midline, indicating a neutral stance.
Volume Analysis:
- On-Balance Volume (OBV): The OBV has shown mixed movements, reflecting uncertainty in the buying and selling pressure.
- Chaikin Money Flow (CMF): The CMF has been negative, indicating a bearish money flow.
Key Observations:
- The trend indicators suggest a bullish sentiment, supported by the moving averages and MACD.
- Momentum indicators show a neutral stance, with the RSI hovering around the midpoint and stochastic oscillators in the overbought zone.
- Volatility remains relatively stable, as indicated by the Bollinger Bands.
- Volume indicators reflect mixed signals, with OBV showing indecision and CMF indicating bearish money flow.
Conclusion:
Based on the analysis of the technical indicators, the next few days for CMA stock price movement could be sideways with a slight bullish bias. While the trend indicators point towards a bullish outlook, the neutral momentum and mixed volume signals suggest a potential consolidation phase. Traders should closely monitor key levels and wait for clearer signals before making significant trading decisions.