Technical Analysis of CLF 2024-05-10
Overview:
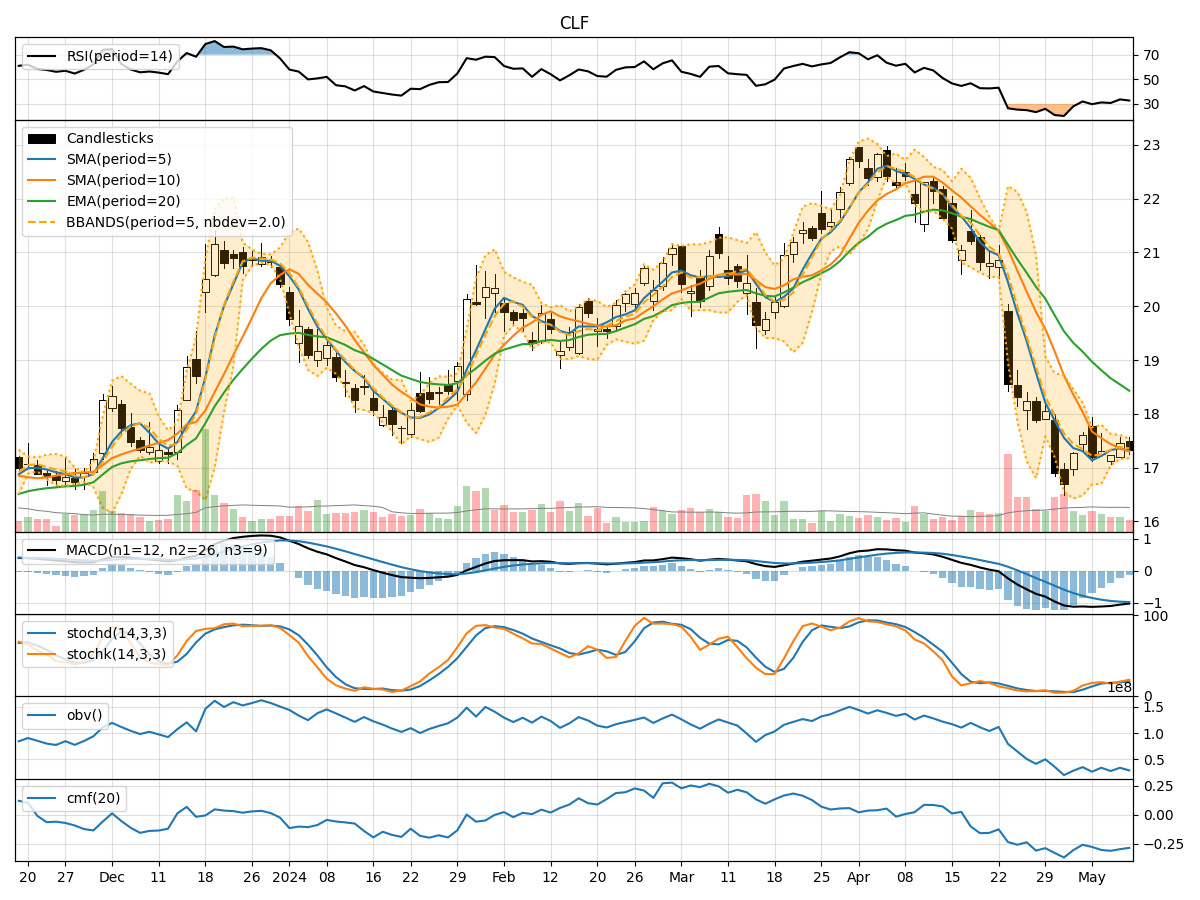
In analyzing the technical indicators for CLF over the last 5 days, we will delve into the trend, momentum, volatility, and volume indicators to provide a comprehensive outlook on the possible stock price movement in the coming days. By examining these key indicators, we aim to offer valuable insights and predictions for potential investors.
Trend Analysis:
- Moving Averages (MA): The 5-day MA has been fluctuating around the closing prices, indicating a lack of clear trend direction.
- MACD: The MACD line has been consistently below the signal line, suggesting a bearish momentum in the short term.
- EMA: The EMA has been declining, indicating a downward trend in the stock price.
Momentum Analysis:
- RSI: The RSI has been hovering around 30-35, indicating oversold conditions but not yet showing a clear reversal signal.
- Stochastic Oscillator: Both %K and %D have been relatively low, suggesting a potential for a reversal but not confirming a strong uptrend.
- Williams %R: The indicator has been in the oversold territory, indicating a potential buying opportunity.
Volatility Analysis:
- Bollinger Bands (BB): The stock price has been trading within the bands, with the lower band acting as a support level.
- BB Percentage (BBP): The BBP has been fluctuating around 0.5, indicating moderate volatility.
- BB Width: The bands have been narrowing, suggesting a potential decrease in volatility.
Volume Analysis:
- On-Balance Volume (OBV): The OBV has been declining, indicating selling pressure in the stock.
- Chaikin Money Flow (CMF): The CMF has been negative, suggesting outflow of money from the stock.
Key Observations:
- The stock is currently in a downtrend based on the moving averages and EMA.
- Momentum indicators show oversold conditions but lack strong reversal signals.
- Volatility is moderate but showing signs of decreasing.
- Volume indicators suggest selling pressure and outflow of money from the stock.
Conclusion:
Based on the analysis of the technical indicators, the next few days for CLF are likely to see further downside movement in the stock price. The trend is bearish, momentum indicators are weak, and volume indicators point towards continued selling pressure. Traders should exercise caution and consider waiting for stronger reversal signals before considering any long positions. A bearish outlook is recommended for the next few days.