Technical Analysis of CLCO 2024-05-10
Overview:
In analyzing the technical indicators for CLCO over the last 5 days, we will delve into the trend, momentum, volatility, and volume indicators to provide a comprehensive assessment of the stock's potential price movement. By examining these key factors, we aim to offer valuable insights and predictions for the next few days.
Trend Analysis:
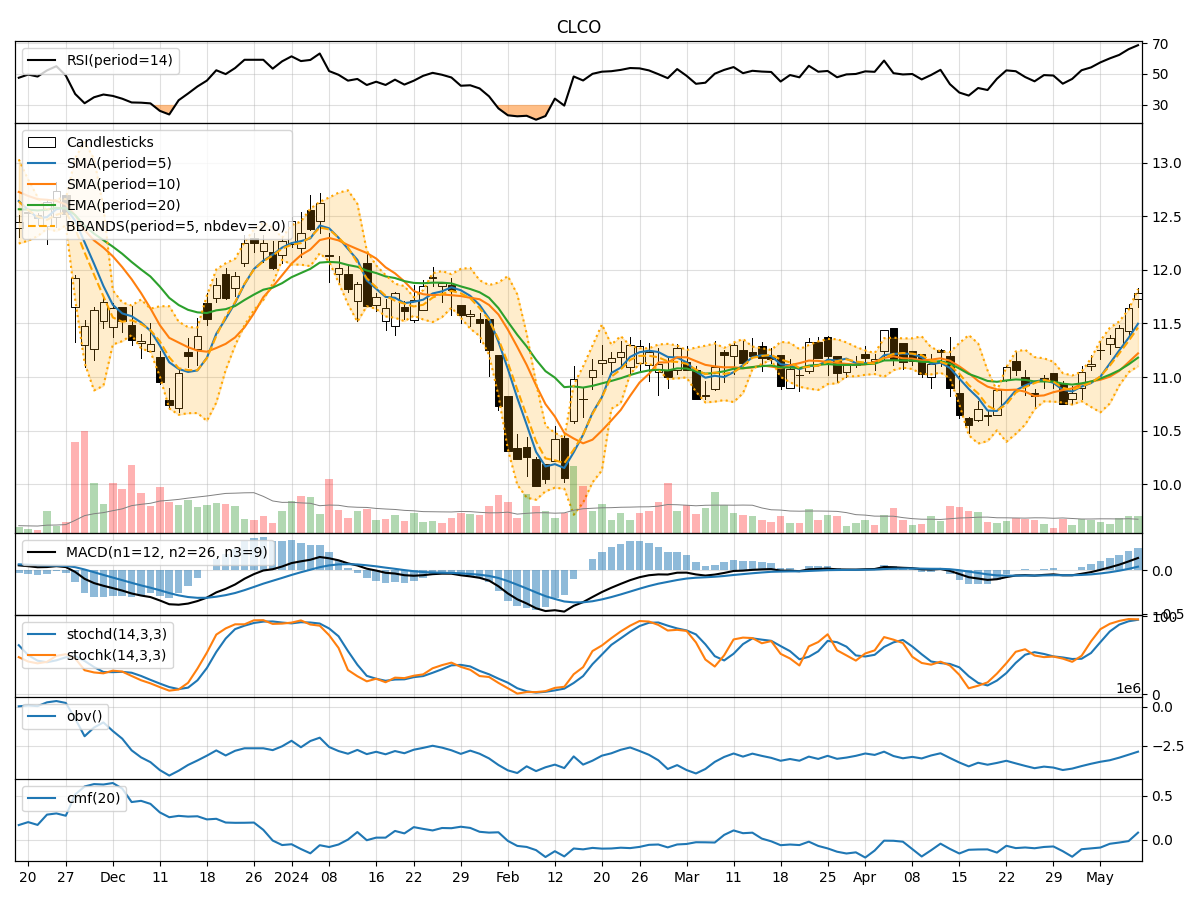
- Moving Averages (MA): The 5-day Moving Average (MA) has been consistently above the Simple Moving Average (SMA) and Exponential Moving Average (EMA), indicating a bullish trend.
- MACD: The MACD line has been consistently above the signal line, with both lines showing an upward trend, suggesting bullish momentum.
- MACD Histogram: The MACD Histogram has been increasing over the past 5 days, indicating strengthening bullish momentum.
Momentum Analysis:
- RSI: The Relative Strength Index (RSI) has been trending upwards and is currently in the overbought territory, suggesting a strong bullish momentum.
- Stochastic Oscillator: Both %K and %D lines of the Stochastic Oscillator are in the overbought zone, indicating a strong bullish momentum.
- Williams %R: The Williams %R is also in the oversold region, further supporting the bullish sentiment.
Volatility Analysis:
- Bollinger Bands: The stock price has been consistently trading above the middle Bollinger Band (BBM), indicating an upward trend.
- Bollinger Band Width: The Bollinger Band Width has been relatively stable, suggesting consistent volatility in the stock price.
Volume Analysis:
- On-Balance Volume (OBV): The OBV indicator has been steadily increasing over the last 5 days, indicating strong buying pressure.
- Chaikin Money Flow (CMF): The CMF has been negative but trending upwards, suggesting a potential reversal in buying pressure.
Conclusion:
Based on the analysis of the technical indicators, the overall outlook for CLCO is strongly bullish. The trend indicators, momentum oscillators, and volume indicators all point towards a continuation of the current upward trend. The stock is likely to experience further price appreciation in the coming days. Traders and investors may consider buying opportunities to capitalize on the bullish momentum.
Key Takeaways:
- Upward Trend: The stock is in a clear upward trend, supported by moving averages and MACD.
- Strong Momentum: RSI, Stochastic Oscillator, and Williams %R all indicate strong bullish momentum.
- Stable Volatility: Bollinger Bands show consistent price movement with stable volatility.
- Increasing Buying Pressure: OBV is rising, indicating accumulation, while CMF suggests a potential shift towards buying.
In conclusion, the next few days are likely to see further price appreciation for CLCO. Traders should consider entering long positions to benefit from the ongoing bullish trend.