Technical Analysis of CIO 2024-05-10
Overview:
In analyzing the technical indicators for CIO stock over the last 5 days, we will delve into the trends, momentum, volatility, and volume aspects to provide a comprehensive outlook on the possible stock price movement in the coming days. By examining key indicators such as moving averages, MACD, RSI, Bollinger Bands, and OBV, we aim to offer valuable insights and predictions for potential price trends.
Trend Analysis:
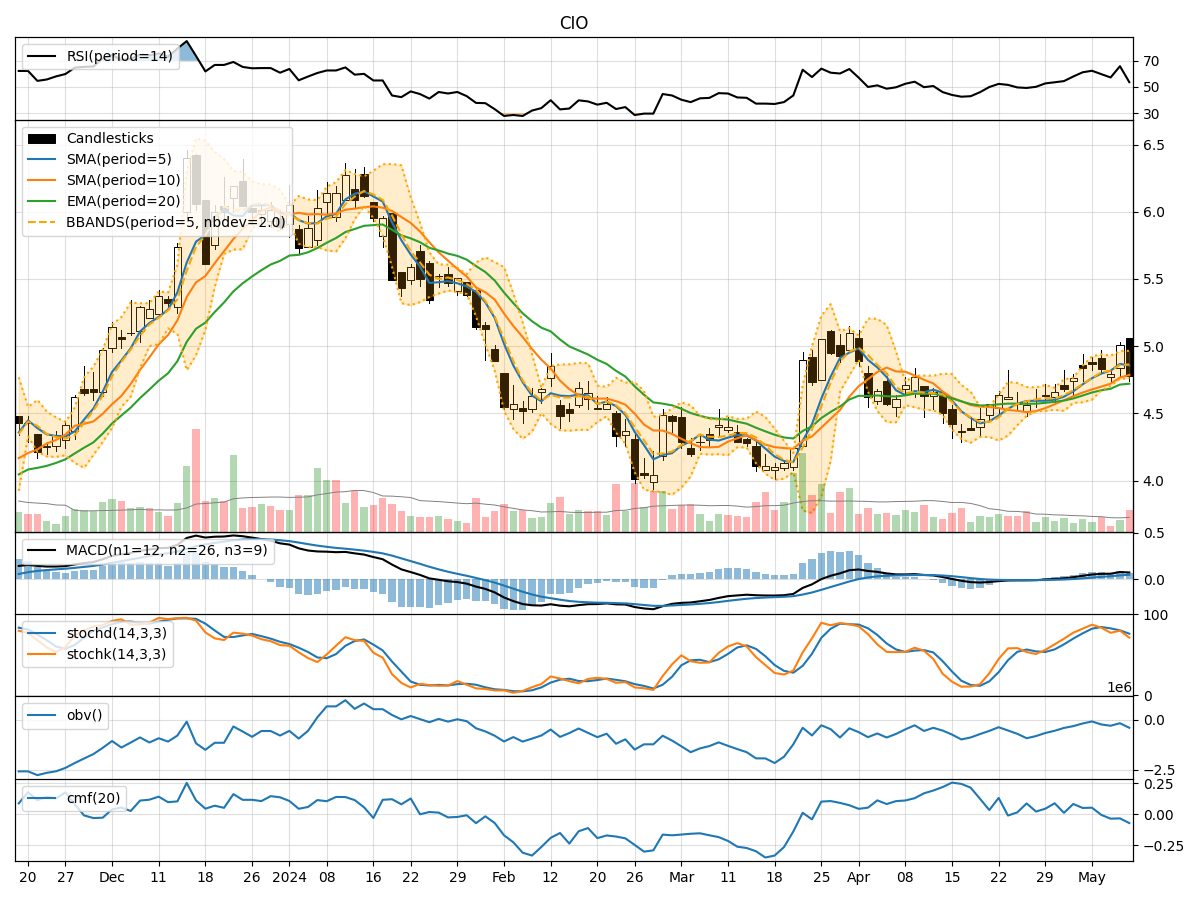
- Moving Averages (MA): The 5-day MA has been fluctuating around the closing prices, indicating short-term price trends.
- MACD: The MACD line has shown positive values, suggesting a bullish momentum in the stock.
Key Observation: The moving averages and MACD signal a bullish trend in the stock price.
Momentum Analysis:
- RSI: The RSI values have been varying but generally staying within the neutral range, indicating balanced buying and selling pressure.
- Stochastic Oscillator: The stochastic indicators have shown a mix of overbought and oversold conditions, reflecting potential price reversals.
Key Observation: Momentum indicators suggest a neutral stance with potential for price fluctuations.
Volatility Analysis:
- Bollinger Bands (BB): The Bollinger Bands have widened and contracted, reflecting fluctuations in price volatility.
Key Observation: Volatility indicators point towards increased price volatility in the stock.
Volume Analysis:
- On-Balance Volume (OBV): The OBV values have fluctuated, indicating mixed buying and selling pressure.
Key Observation: Volume indicators suggest indecisiveness in market participation.
Conclusion:
Based on the analysis of the technical indicators, the stock of CIO is likely to experience upward price movement in the coming days, supported by the bullish trend indicated by moving averages and MACD. However, the neutral momentum and mixed volume signals suggest potential price fluctuations and indecisiveness among market participants. The increased volatility also indicates the possibility of sharp price movements. Traders should closely monitor price action and key support/resistance levels for timely decision-making.
Recommendation:
- Short-term Traders: Consider taking advantage of potential price swings but remain cautious of sudden reversals.
- Long-term Investors: Monitor the trend closely and consider accumulating positions on pullbacks for a favorable risk-reward ratio.
By combining technical analysis with market insights, investors can make informed decisions aligned with their risk tolerance and investment objectives.