Technical Analysis of CI 2024-05-10
Overview:
In analyzing the technical indicators for CI stock over the last 5 days, we will delve into the trend, momentum, volatility, and volume indicators to provide a comprehensive outlook on the possible stock price movement in the coming days. By examining these key indicators, we aim to offer valuable insights and predictions for potential investors and traders.
Trend Analysis:
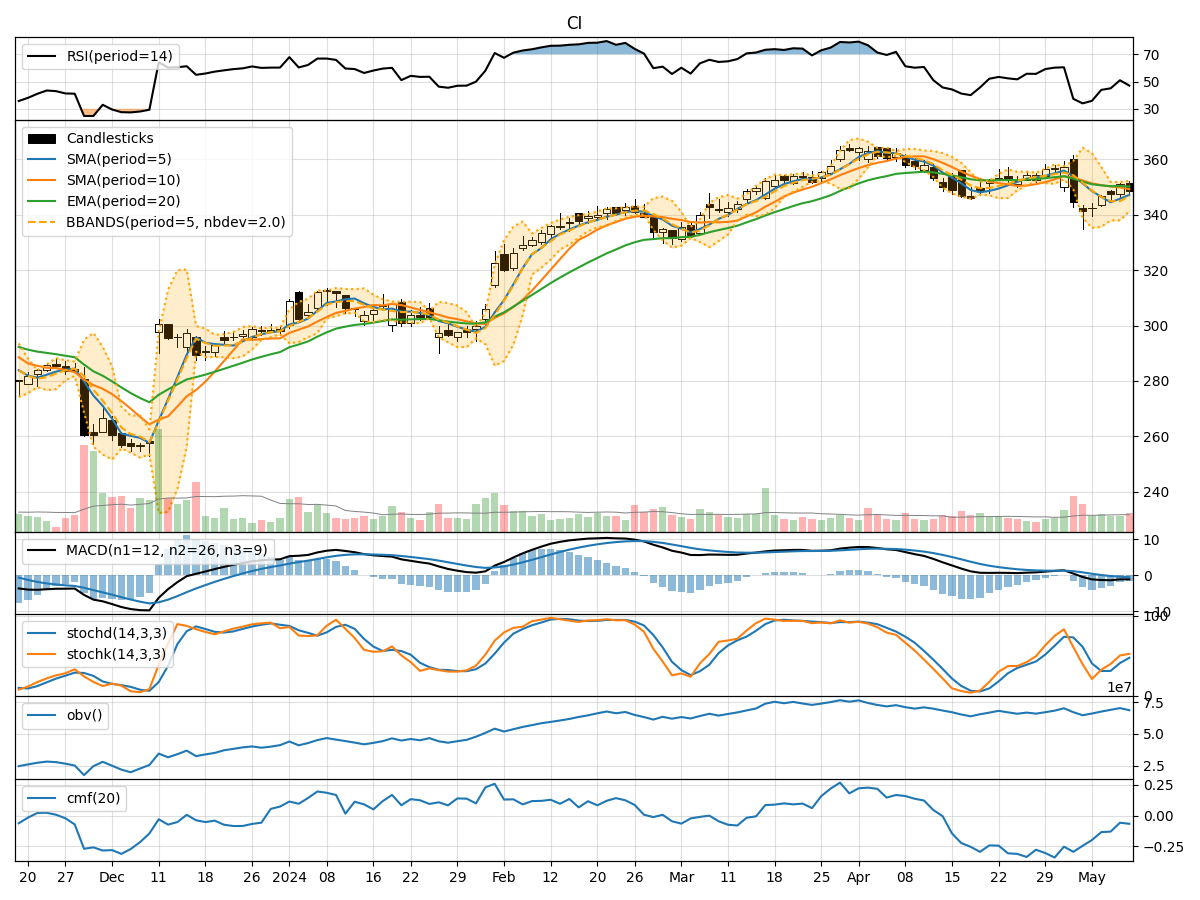
- Moving Averages (MA): The 5-day MA has been consistently below the closing prices, indicating a short-term downtrend.
- MACD: The MACD line has been below the signal line, suggesting a bearish momentum.
- EMA: The EMA has been declining, further supporting the bearish trend.
Key Observation: The trend indicators point towards a downward trend in the stock price.
Momentum Analysis:
- RSI: The RSI has been fluctuating but is currently below 50, indicating a bearish momentum.
- Stochastic Oscillator: Both %K and %D have been trending downwards, signaling a bearish sentiment.
- Williams %R: The indicator has been in the oversold territory, suggesting a potential reversal.
Key Observation: Momentum indicators reflect a bearish sentiment in the stock.
Volatility Analysis:
- Bollinger Bands: The stock price has been trading within the bands, indicating a period of consolidation.
- Bollinger %B: The %B is hovering around 0.5, suggesting a neutral stance.
- Average True Range (ATR): The ATR has been relatively stable, indicating low volatility.
Key Observation: Volatility indicators suggest a sideways movement in the stock price.
Volume Analysis:
- On-Balance Volume (OBV): The OBV has been fluctuating but has not shown a clear trend.
- Chaikin Money Flow (CMF): The CMF has been negative, indicating selling pressure.
Key Observation: Volume indicators do not provide a clear direction but hint at selling pressure.
Conclusion:
Based on the analysis of trend, momentum, volatility, and volume indicators, the overall outlook for CI stock in the next few days is bearish. The trend indicators, momentum oscillators, and volume analysis all point towards a continued downward movement in the stock price. While volatility indicators suggest a period of consolidation, the overall sentiment remains negative.
Key Conclusion: The stock is likely to experience further downward movement in the coming days. Investors should exercise caution and consider potential shorting opportunities or wait for a clearer signal before entering a long position.