Technical Analysis of CHT 2024-05-10
Overview:
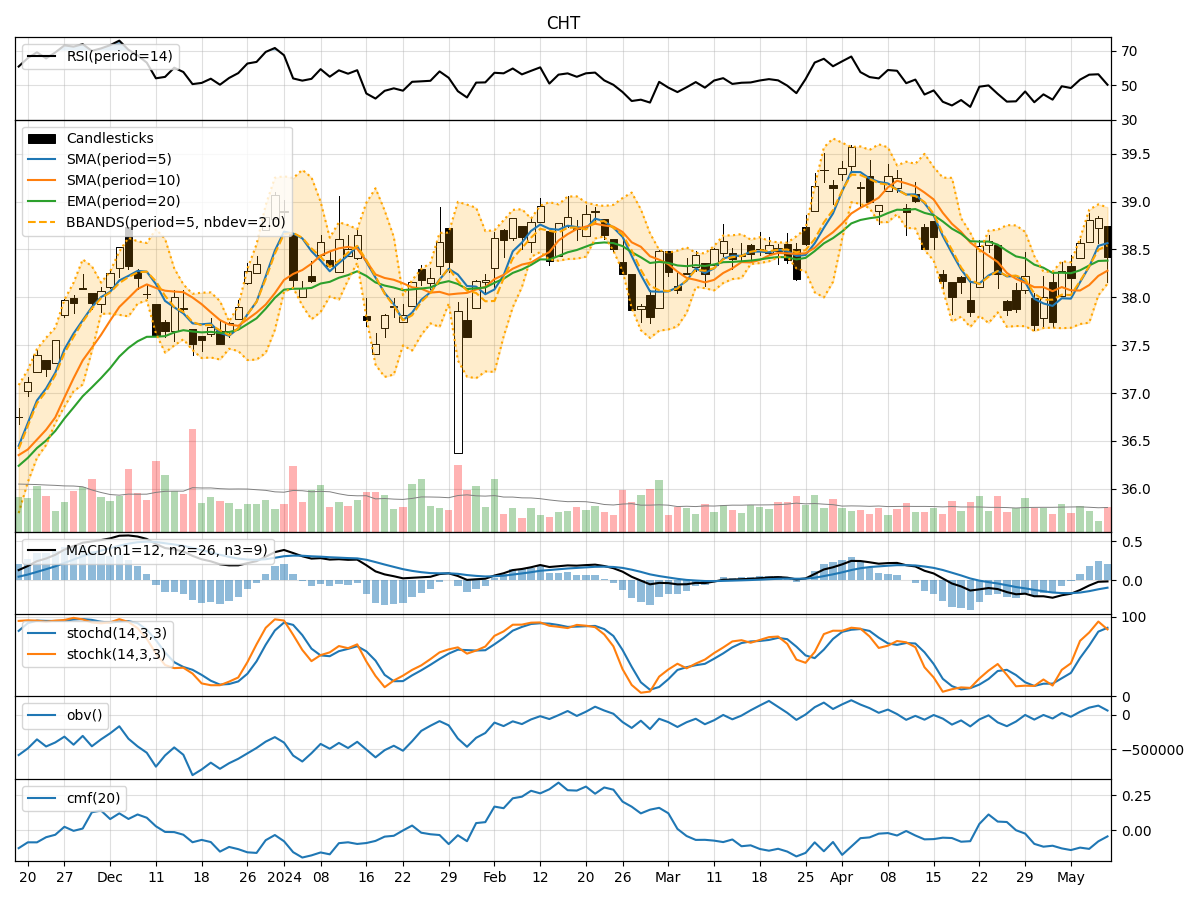
In analyzing the technical indicators for CHT over the last 5 days, we will delve into the trend, momentum, volatility, and volume indicators to provide a comprehensive outlook on the possible stock price movement in the coming days. By examining these key indicators, we aim to offer valuable insights and predictions for potential investors and traders.
Trend Indicators:
- Moving Averages (MA): The 5-day MA has been relatively stable, indicating a consistent trend in the stock price.
- MACD: The MACD line has been hovering around the signal line, suggesting a lack of strong momentum in either direction.
- EMA: The EMA has shown a slight upward trend, indicating a potential bullish sentiment in the short term.
Momentum Indicators:
- RSI: The RSI has been fluctuating around the neutral zone, indicating a balanced momentum between buying and selling pressure.
- Stochastic Oscillator: The stochastic indicators have shown overbought conditions, suggesting a possible reversal in the stock price.
- Williams %R: The Williams %R has been in the oversold territory, signaling a potential buying opportunity.
Volatility Indicators:
- Bollinger Bands (BB): The Bollinger Bands have been narrowing, indicating decreasing volatility and a potential breakout in the near future.
- BB% (Bollinger Band %B): The BB% has been relatively low, suggesting a consolidation phase in the stock price.
Volume Indicators:
- On-Balance Volume (OBV): The OBV has shown a mixed trend, indicating indecision among market participants.
- Chaikin Money Flow (CMF): The CMF has been negative, suggesting a lack of buying pressure in the stock.
Key Observations and Opinions:
- Trend: The trend indicators suggest a neutral to slightly bullish sentiment in the short term.
- Momentum: The momentum indicators point towards a potential reversal in the stock price due to overbought and oversold conditions.
- Volatility: The narrowing Bollinger Bands indicate a period of low volatility and a potential breakout.
- Volume: The volume indicators reflect indecision among investors, with a lack of significant buying pressure.
Conclusion:
Based on the analysis of the technical indicators, the next few days' possible stock price movement for CHT is likely to experience a consolidation phase with sideways trading. Investors should exercise caution and wait for a clear breakout or trend confirmation before making significant trading decisions. The stock is expected to trade within a narrow range, with potential for a breakout in either direction depending on market sentiment and external factors.