Technical Analysis of CHD 2024-05-10
Overview:
In analyzing the technical indicators for CHD over the last 5 days, we will delve into the trend, momentum, volatility, and volume indicators to provide a comprehensive outlook on the possible stock price movement. By examining these key aspects, we aim to offer valuable insights and predictions for the upcoming days.
Trend Analysis:
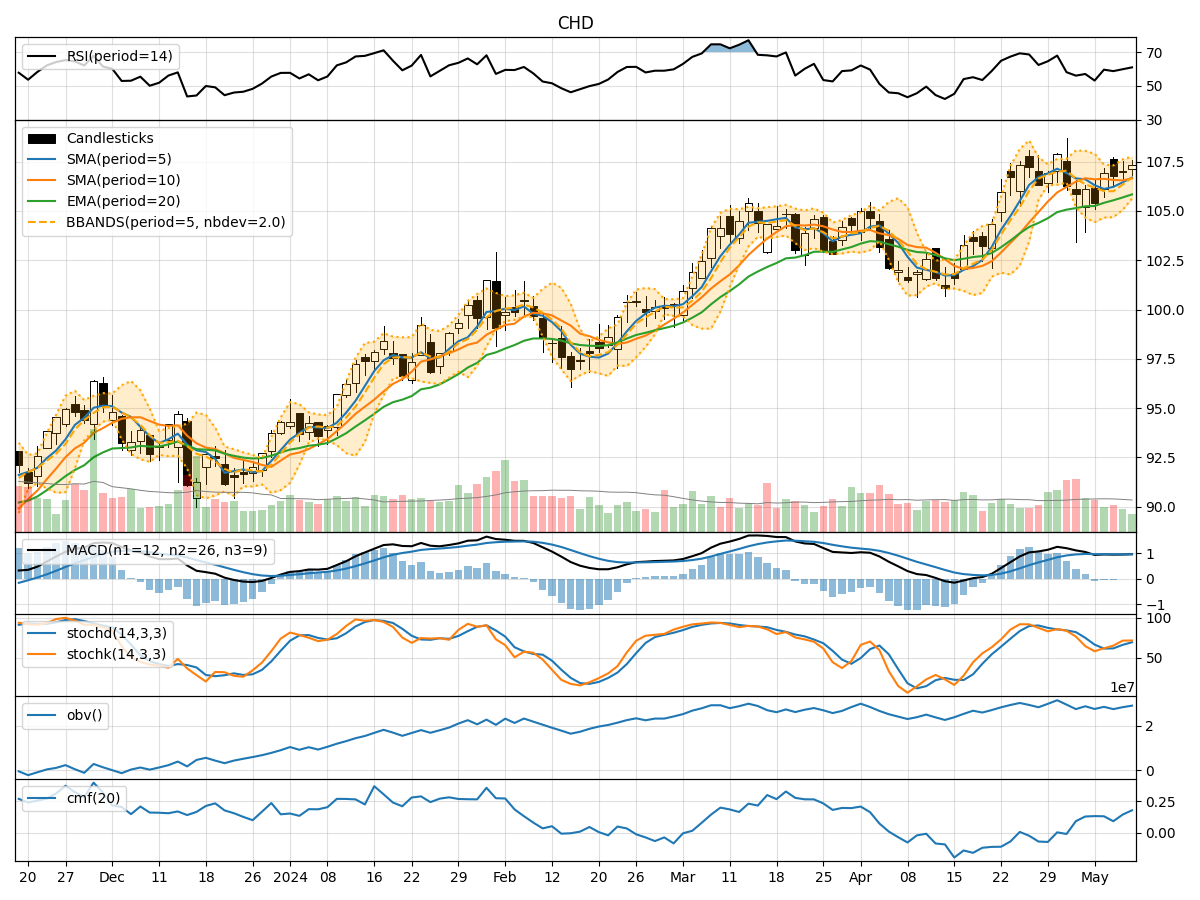
- Moving Averages (MA): The 5-day Moving Average (MA) has been fluctuating around the closing prices, indicating short-term price trends. The Simple Moving Average (SMA) and Exponential Moving Average (EMA) show a slight upward trend, suggesting a potential bullish sentiment.
- MACD: The Moving Average Convergence Divergence (MACD) and its signal line (MACDH) have been consistently negative but narrowing, hinting at a possible trend reversal towards the upside.
Momentum Analysis:
- RSI: The Relative Strength Index (RSI) has been gradually increasing, reflecting strengthening buying momentum.
- Stochastic Oscillator: Both %K and %D lines of the Stochastic Oscillator are in the overbought region, indicating a potential reversal or consolidation in the near term.
- Williams %R: The Williams %R is in the oversold territory, suggesting a possible buying opportunity.
Volatility Analysis:
- Bollinger Bands (BB): The Bollinger Bands are narrowing, indicating decreasing volatility and a potential price breakout in the near future.
Volume Analysis:
- On-Balance Volume (OBV): The OBV has been fluctuating, suggesting indecision among investors regarding the stock.
- Chaikin Money Flow (CMF): The CMF has been gradually increasing, indicating a potential inflow of money into the stock.
Key Observations and Opinions:
- Trend: The trend indicators suggest a potential bullish sentiment in the short term.
- Momentum: The momentum indicators show mixed signals, with RSI indicating strength but Stochastic Oscillator signaling overbought conditions.
- Volatility: The narrowing Bollinger Bands point towards a potential breakout, indicating a forthcoming price movement.
- Volume: The volume indicators reflect indecision among investors, with OBV fluctuating and CMF showing a slight increase.
Conclusion:
Based on the analysis of the technical indicators, the stock price of CHD is likely to experience upward momentum in the next few days. The trend indicators support a bullish view, while the momentum indicators suggest a potential reversal or consolidation. The narrowing Bollinger Bands indicate a breakout, and the volume indicators hint at investor indecision. Overall, the outlook for CHD is bullish in the short term, with the possibility of a price increase in the coming days.