Technical Analysis of CGA 2024-05-10
Overview:
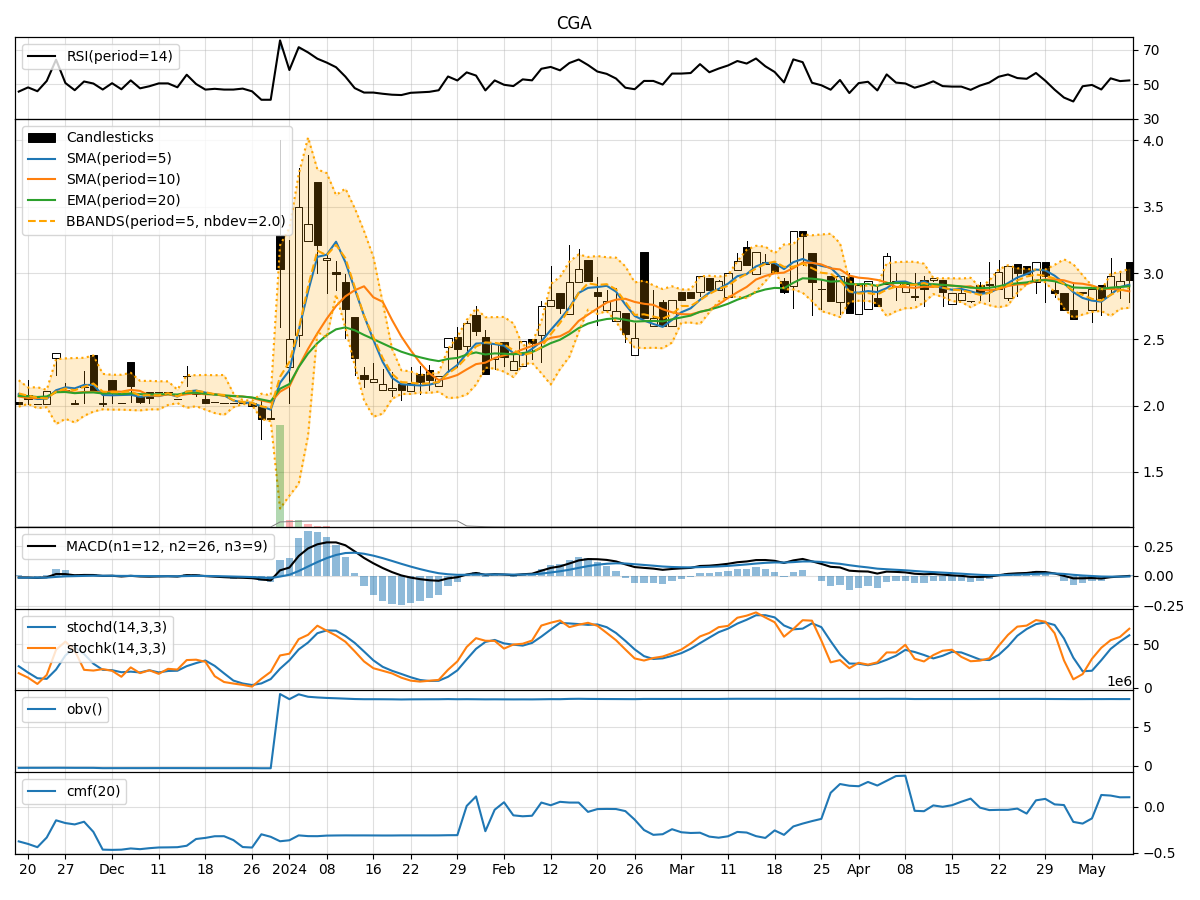
In analyzing the technical indicators for CGA over the last 5 days, we will delve into the trend, momentum, volatility, and volume indicators to provide a comprehensive outlook on the possible stock price movement in the coming days. By examining these key indicators, we aim to offer valuable insights and predictions for potential investors.
Trend Analysis:
- Moving Averages (MA): The 5-day Moving Average (MA) has been fluctuating around the closing prices, indicating short-term price trends. The Simple Moving Average (SMA) and Exponential Moving Average (EMA) show a mixed trend, with the EMA slightly above the SMA.
- MACD: The Moving Average Convergence Divergence (MACD) has been negative but showing signs of convergence towards the signal line, suggesting a potential reversal in the short term.
Momentum Analysis:
- RSI: The Relative Strength Index (RSI) has been hovering around the neutral zone, indicating a balanced momentum between buying and selling pressure.
- Stochastic Oscillator: The Stochastic Oscillator shows an upward trend, reaching overbought levels, which may signal a potential reversal or consolidation.
- Williams %R: The Williams %R indicator is in the oversold territory, suggesting a possible buying opportunity in the near future.
Volatility Analysis:
- Bollinger Bands: The Bollinger Bands are widening, indicating increased volatility in the stock price. The upper and lower bands are expanding, suggesting potential price swings in either direction.
- Bollinger %B: The %B indicator is below 1, indicating that the stock price is trading below the lower Bollinger Band, which may signal an oversold condition.
Volume Analysis:
- On-Balance Volume (OBV): The OBV indicator has been fluctuating, indicating mixed buying and selling pressure in the stock.
- Chaikin Money Flow (CMF): The CMF is positive, suggesting that money is flowing into the stock over the 20-day period.
Conclusion:
Based on the analysis of the technical indicators, the stock of CGA shows mixed signals for the next few days. - Trend: The trend indicators suggest a potential reversal or consolidation in the short term. - Momentum: The momentum indicators show conflicting signals, with the RSI neutral, Stochastic overbought, and Williams %R oversold. - Volatility: The widening Bollinger Bands indicate increased volatility, while the %B suggests an oversold condition. - Volume: The volume indicators show mixed buying and selling pressure.
Overall Assessment:
Considering the mixed signals from the technical indicators, it is challenging to provide a definitive prediction. However, the stock may experience a period of consolidation or a slight upward movement in the coming days. Investors should closely monitor key levels and wait for clearer signals before making trading decisions.