Technical Analysis of CEPU 2024-05-10
Overview:
In analyzing the technical indicators for CEPU over the last 5 days, we will delve into the trend, momentum, volatility, and volume indicators to provide a comprehensive outlook on the possible stock price movement. By examining these key aspects, we aim to offer valuable insights and predictions for the upcoming days.
Trend Indicators:
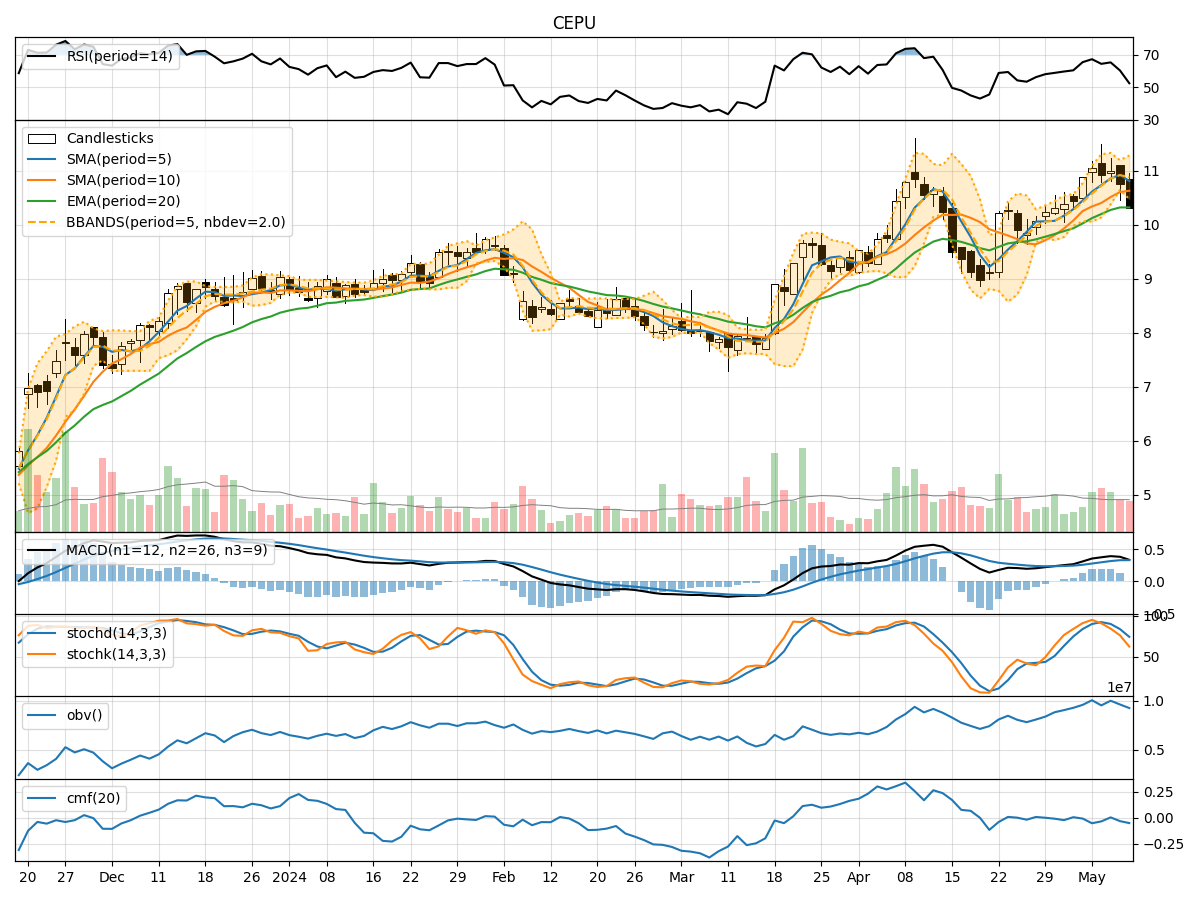
- Moving Averages (MA): The 5-day MA has been consistently above the closing prices, indicating a bullish trend.
- MACD: The MACD line has been above the signal line, suggesting a positive momentum in the stock price.
- RSI: The RSI values have been fluctuating but generally staying above 50, indicating a bullish sentiment.
Momentum Indicators:
- Stochastic Oscillator: The stochastic indicators have been gradually decreasing, signaling a potential reversal in momentum.
- Williams %R: The Williams %R values have been in oversold territory, indicating a possible buying opportunity.
Volatility Indicators:
- Bollinger Bands: The stock price has been trading within the Bollinger Bands, suggesting a period of consolidation.
- Volatility: The volatility has been decreasing, indicating a potential stabilization in the stock price.
Volume Indicators:
- On-Balance Volume (OBV): The OBV has been fluctuating, indicating mixed sentiment among investors.
- Chaikin Money Flow (CMF): The CMF has been negative, suggesting a bearish outlook on the stock.
Key Observations:
- The trend indicators suggest a bullish sentiment in the short term.
- Momentum indicators show a potential reversal in momentum.
- Volatility indicators point towards a period of consolidation.
- Volume indicators reflect mixed sentiment among investors.
Conclusion:
Based on the analysis of the technical indicators, the next few days for CEPU could see sideways movement with a slight bullish bias. Traders may consider monitoring the stochastic indicators for a potential reversal in momentum and the RSI for confirmation of the bullish sentiment. Additionally, keeping an eye on the OBV for any significant shifts in volume sentiment could provide further insights into the stock's price movement. It is essential to exercise caution and consider risk management strategies in trading or investing in CEPU based on the current technical outlook.