Technical Analysis of CE 2024-05-10
Overview:
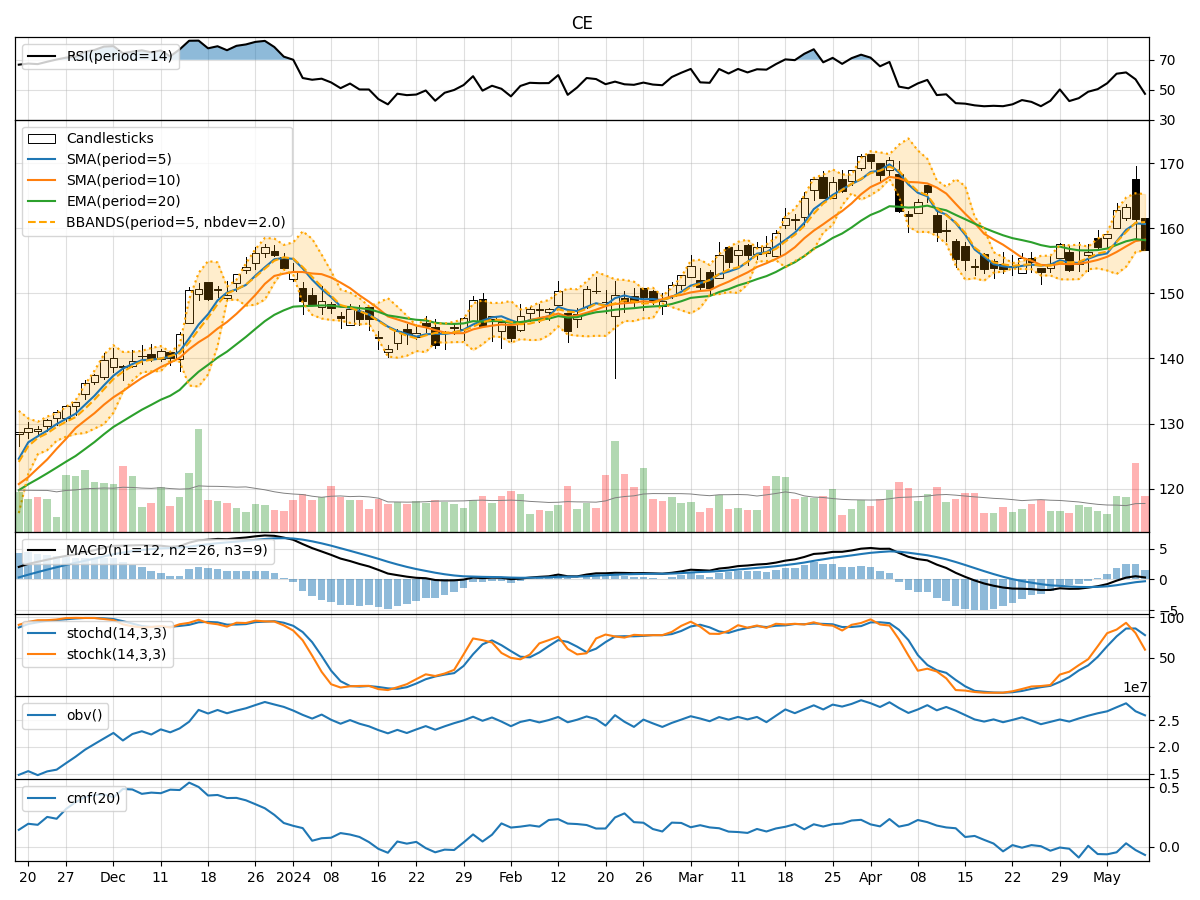
In analyzing the technical indicators for CE stock over the last 5 days, we will delve into the trend, momentum, volatility, and volume indicators to provide a comprehensive outlook on the possible stock price movement in the coming days.
Trend Analysis:
- Moving Averages (MA): The 5-day Moving Average (MA) has been consistently above the Simple Moving Average (SMA) and Exponential Moving Average (EMA), indicating a bullish trend.
- MACD: The MACD line has been above the signal line, with both lines showing an upward trend, suggesting a bullish momentum.
- RSI: The Relative Strength Index (RSI) has been fluctuating around the neutral zone, indicating a lack of strong trend direction.
Momentum Analysis:
- Stochastic Oscillator: The Stochastic Oscillator has been fluctuating within the overbought and oversold levels, suggesting a mixed momentum.
- Williams %R: The Williams %R indicator has been consistently in the oversold territory, indicating a bearish momentum.
Volatility Analysis:
- Bollinger Bands: The stock price has been trading within the Bollinger Bands, with the bands narrowing, indicating decreasing volatility.
- Bollinger %B: The %B indicator has been hovering around the middle range, suggesting a neutral volatility outlook.
Volume Analysis:
- On-Balance Volume (OBV): The OBV has shown mixed movements, indicating indecision among investors.
- Chaikin Money Flow (CMF): The CMF has been negative, suggesting a bearish money flow trend.
Key Observations:
- The trend indicators suggest a bullish sentiment in the short term.
- Momentum indicators show mixed signals, with stochastic oscillating between overbought and oversold levels.
- Volatility is decreasing, indicating a potential consolidation phase.
- Volume indicators reflect indecision among investors, with a bearish money flow trend.
Conclusion:
Based on the analysis of the technical indicators, the next few days for CE stock are likely to see sideways movement with a slight bullish bias. The decreasing volatility and mixed momentum signals suggest a period of consolidation, while the bullish trend indicators hint at a potential upward movement. Investors should closely monitor key support and resistance levels for potential breakout opportunities.