Technical Analysis of CCU 2024-05-10
Overview:
In analyzing the technical indicators for CCU over the last 5 days, we will delve into the trend, momentum, volatility, and volume indicators to provide a comprehensive outlook on the possible stock price movement in the coming days.
Trend Analysis:
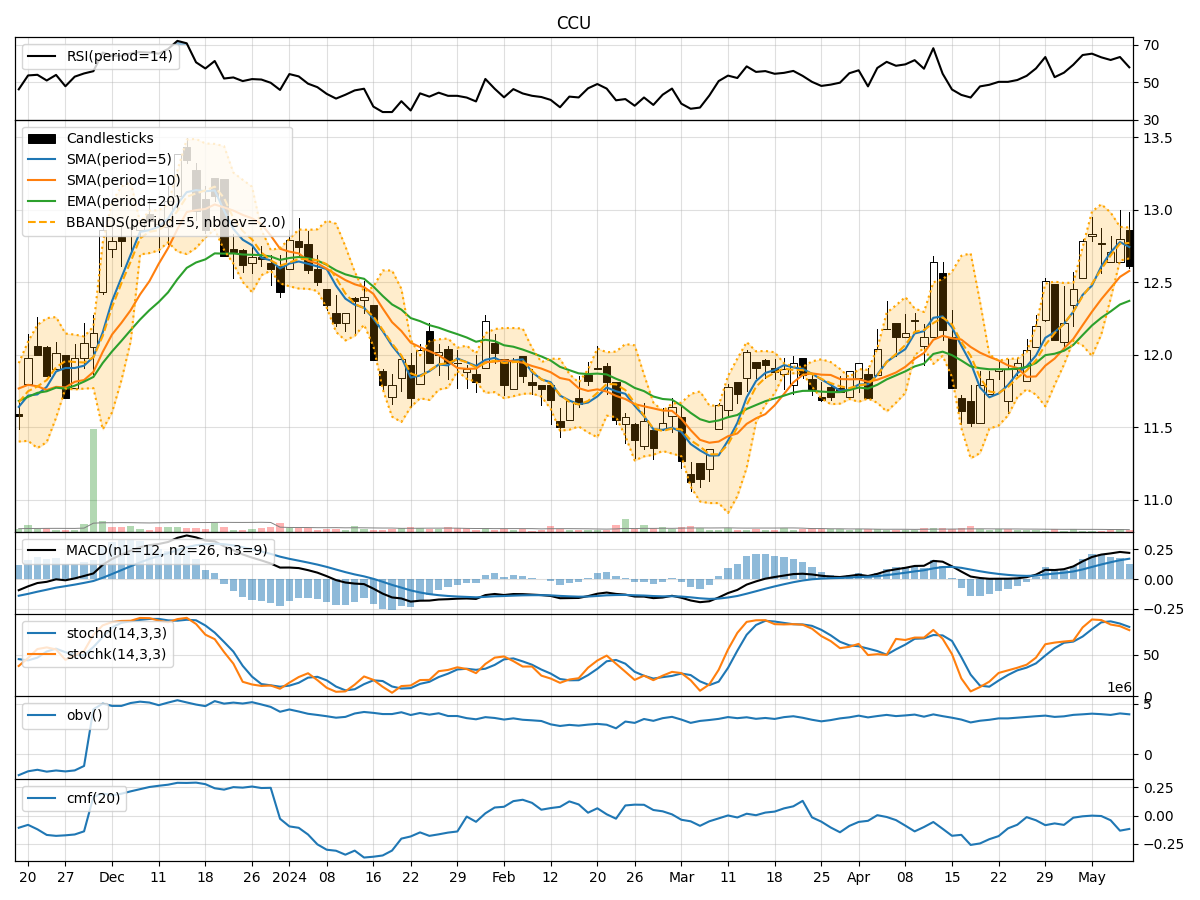
- Moving Averages (MA): The 5-day Moving Average (MA) has been consistently above the Simple Moving Average (SMA) and Exponential Moving Average (EMA), indicating a bullish trend.
- MACD: The MACD line has been above the signal line, with both lines showing an upward trend, suggesting positive momentum in the stock price.
Momentum Analysis:
- RSI: The Relative Strength Index (RSI) has been fluctuating around the 60-70 range, indicating a neutral momentum.
- Stochastic Oscillator: Both %K and %D have been gradually decreasing, signaling a potential bearish momentum.
Volatility Analysis:
- Bollinger Bands (BB): The stock price has been trading within the Bollinger Bands, with the bands narrowing, suggesting a decrease in volatility.
Volume Analysis:
- On-Balance Volume (OBV): The OBV has been fluctuating, indicating indecision among investors.
- Chaikin Money Flow (CMF): The CMF has been negative, suggesting selling pressure in the stock.
Key Observations:
- The trend indicators point towards a bullish sentiment in the stock price.
- Momentum indicators show a mixed signal, with RSI neutral and Stochastic Oscillator indicating a potential bearish momentum.
- Volatility has been decreasing, indicating a possible consolidation phase.
- Volume indicators reflect indecision among investors, with selling pressure indicated by CMF.
Conclusion:
Based on the analysis of the technical indicators, the next few days' possible stock price movement for CCU is likely to be sideways with a slight bearish bias. The bullish trend indicated by moving averages and MACD may face resistance due to the neutral to bearish momentum signals from RSI and Stochastic Oscillator. The decreasing volatility suggests a consolidation phase, while the volume indicators point towards selling pressure. Investors should exercise caution and closely monitor the stock for potential downside risks in the coming days.