Technical Analysis of CCJ 2024-05-10
Overview:
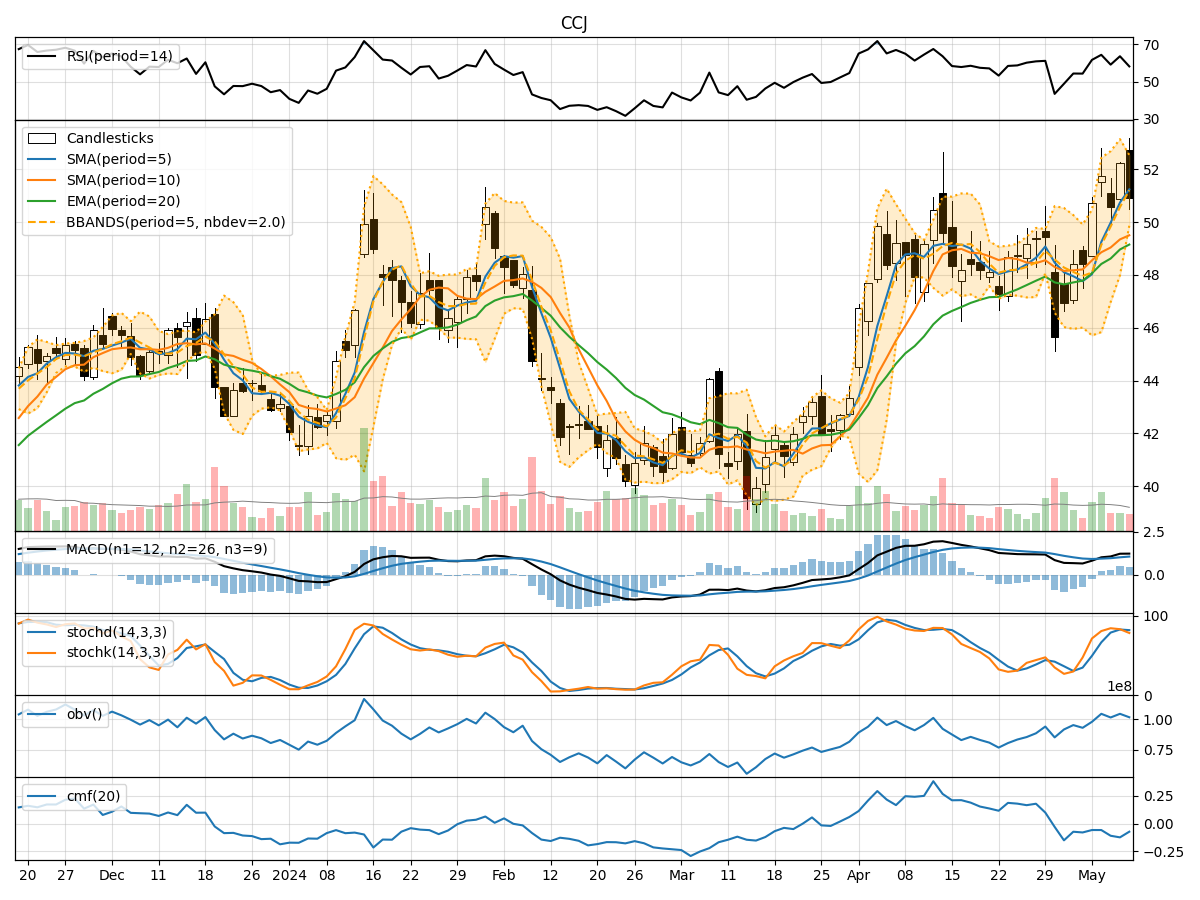
In analyzing the technical indicators for CCJ over the last 5 days, we will delve into the trend, momentum, volatility, and volume indicators to provide a comprehensive outlook on the possible stock price movement. By examining these key factors, we aim to offer valuable insights and predictions for the upcoming days.
Trend Indicators:
- Moving Averages (MA): The 5-day Moving Average has been consistently rising, indicating a bullish trend in the short term.
- MACD: The MACD line has been above the signal line, suggesting positive momentum in the stock price.
- EMA: The Exponential Moving Average has also been trending upwards, supporting the bullish sentiment.
Momentum Indicators:
- RSI: The Relative Strength Index has been fluctuating but generally staying within the neutral to slightly overbought territory.
- Stochastic Oscillator: Both %K and %D have been relatively high, indicating potential overbought conditions.
- Williams %R: The Williams %R has been hovering in the oversold region, suggesting a possible reversal.
Volatility Indicators:
- Bollinger Bands: The stock price has been trading within the Bollinger Bands, with the bands widening slightly, indicating increased volatility.
- Bollinger %B: The %B indicator has been fluctuating within the bands, reflecting the stock's price relative to the bands.
Volume Indicators:
- On-Balance Volume (OBV): The OBV has been fluctuating, indicating mixed buying and selling pressure.
- Chaikin Money Flow (CMF): The CMF has been negative, suggesting outflows from the stock.
Key Observations:
- The trend indicators suggest a bullish sentiment in the short term, supported by the moving averages and MACD.
- Momentum indicators show mixed signals, with RSI indicating a neutral stance, while stochastic oscillators hint at potential overbought conditions.
- Volatility has increased slightly, as seen in the widening Bollinger Bands, indicating potential price fluctuations.
- Volume indicators reflect mixed sentiment, with OBV fluctuating and CMF showing negative flows.
Conclusion:
Based on the analysis of the technical indicators, the stock price of CCJ is likely to experience further upward movement in the coming days. The bullish trend indicated by the moving averages and MACD, coupled with the slightly increased volatility, suggests potential price appreciation. However, caution is advised due to the mixed signals from momentum and volume indicators. Traders and investors should closely monitor the price action and key support/resistance levels for timely decision-making.