Technical Analysis of CBRE 2024-05-10
Overview:
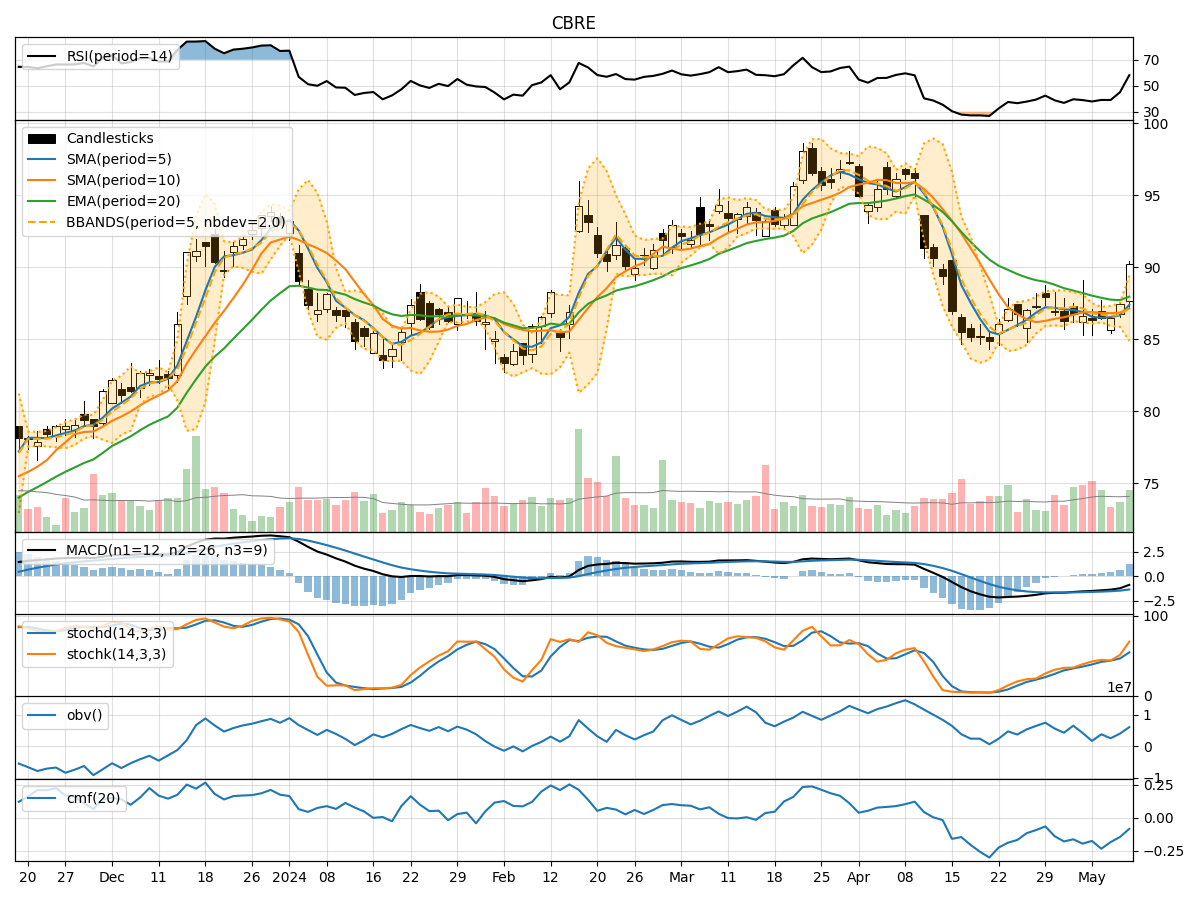
In analyzing the technical indicators for CBRE over the last 5 days, we will delve into the trend, momentum, volatility, and volume indicators to provide a comprehensive outlook on the possible stock price movement in the coming days. By examining these key factors, we aim to offer valuable insights and predictions for potential investors.
Trend Analysis:
- Moving Averages (MA): The 5-day Moving Average (MA) has been fluctuating around the closing prices, indicating short-term price trends. The Simple Moving Average (SMA) and Exponential Moving Average (EMA) show a downward trend, with the EMA lagging behind.
- MACD: The Moving Average Convergence Divergence (MACD) is negative, suggesting a bearish momentum in the stock price.
- Conclusion: The trend indicators point towards a downward trend in the stock price.
Momentum Analysis:
- RSI: The Relative Strength Index (RSI) has been increasing, indicating a strengthening momentum in the stock price.
- Stochastic Oscillator: Both %K and %D of the Stochastic Oscillator are rising, signaling an uptrend in momentum.
- Conclusion: Momentum indicators suggest a bullish momentum in the stock price.
Volatility Analysis:
- Bollinger Bands (BB): The Bollinger Bands are widening, indicating increased volatility in the stock price.
- Conclusion: Volatility indicators show an increasing volatility in the stock price.
Volume Analysis:
- On-Balance Volume (OBV): The OBV has been fluctuating, indicating mixed buying and selling pressure.
- Chaikin Money Flow (CMF): The CMF is negative, suggesting a bearish money flow trend.
- Conclusion: Volume indicators reflect mixed signals in buying and selling pressure.
Conclusion:
Based on the analysis of the technical indicators, the next few days' possible stock price movement for CBRE is as follows: - Trend: The trend indicators suggest a downward trend in the stock price. - Momentum: Momentum indicators indicate a bullish momentum in the stock price. - Volatility: Volatility indicators show an increasing volatility in the stock price. - Volume: Volume indicators reflect mixed signals in buying and selling pressure.
Overall Assessment:
Considering the conflicting signals from the different technical indicators, it is essential to proceed with caution. While momentum is bullish, the overall trend is downward, and volatility is increasing. Investors should closely monitor the stock price movement and consider a balanced approach to trading, taking into account both short-term momentum and long-term trend signals.