Technical Analysis of BWA 2024-05-10
Overview:
In analyzing the technical indicators for BWA over the last 5 days, we will delve into the trend, momentum, volatility, and volume indicators to provide a comprehensive outlook on the possible stock price movement in the coming days.
Trend Indicators:
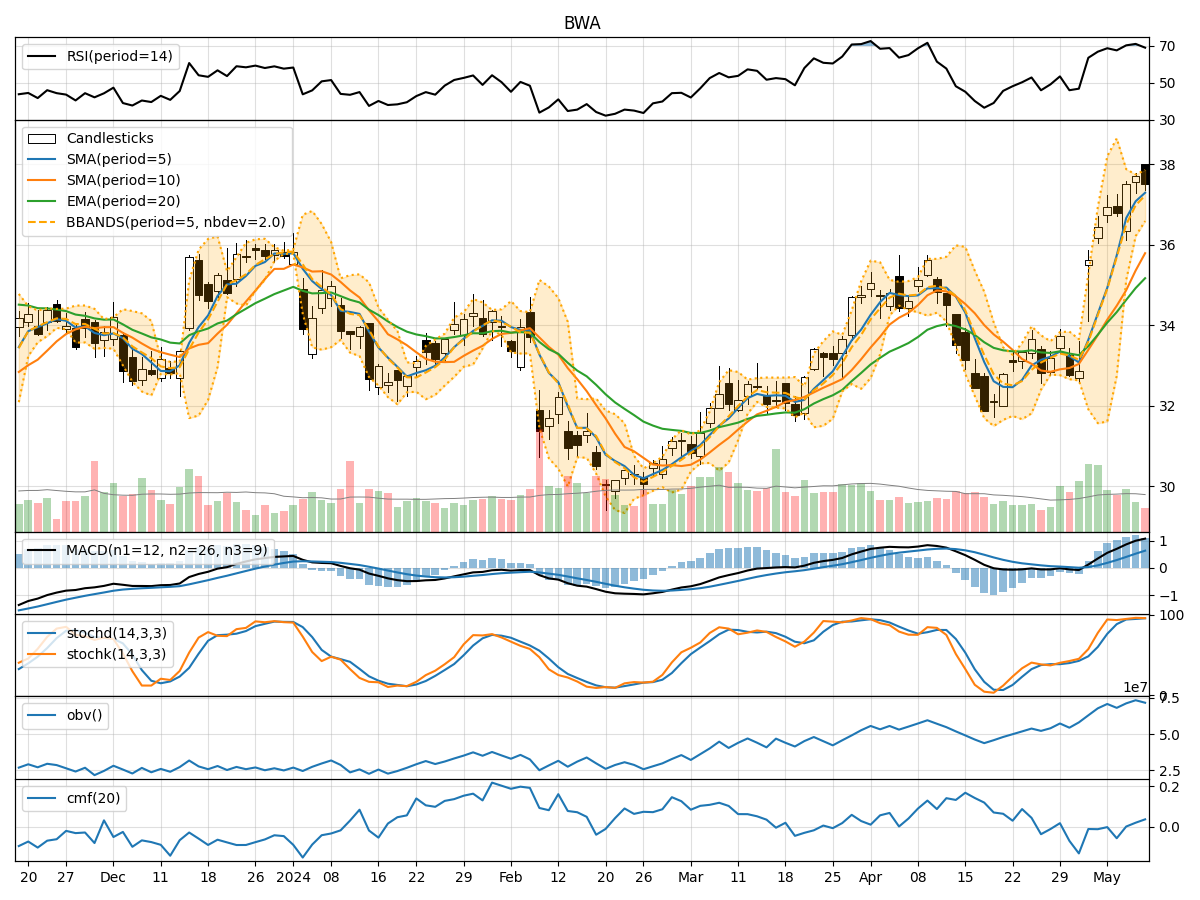
- Moving Averages (MA): The 5-day Moving Average has been consistently rising, indicating a bullish trend in the short term.
- MACD: The MACD line has been above the signal line for the past 5 days, suggesting a bullish momentum.
- EMA: The Exponential Moving Average has also been trending upwards, supporting the bullish sentiment.
Momentum Indicators:
- RSI: The Relative Strength Index has been hovering in the overbought territory, indicating a strong bullish momentum.
- Stochastic Oscillator: Both %K and %D lines have been in the overbought zone, signaling a potential reversal or consolidation.
- Williams %R: The indicator has been in the oversold region, suggesting a possible reversal in the short term.
Volatility Indicators:
- Bollinger Bands: The bands have been widening, indicating increased volatility in the stock price.
- Bollinger %B: The %B indicator has been fluctuating, suggesting potential price reversals or breakouts.
Volume Indicators:
- On-Balance Volume (OBV): The OBV has been showing mixed signals, reflecting indecision among market participants.
- Chaikin Money Flow (CMF): The CMF has been slightly positive, indicating some buying pressure in the stock.
Key Observations:
- The trend indicators suggest a strong bullish sentiment in the short term.
- Momentum indicators point towards a potential reversal or consolidation due to overbought conditions.
- Volatility indicators indicate increased price fluctuations and potential breakouts.
- Volume indicators show mixed signals, reflecting uncertainty in market participation.
Conclusion:
Based on the analysis of the technical indicators, the stock of BWA is likely to experience further upward movement in the coming days, supported by the bullish trend and momentum. However, caution is advised as the overbought conditions in the momentum indicators and increased volatility could lead to a short-term consolidation or a potential pullback before resuming the uptrend. Traders should closely monitor key support and resistance levels for timely decision-making.