Technical Analysis of BUD 2024-05-03
Overview:
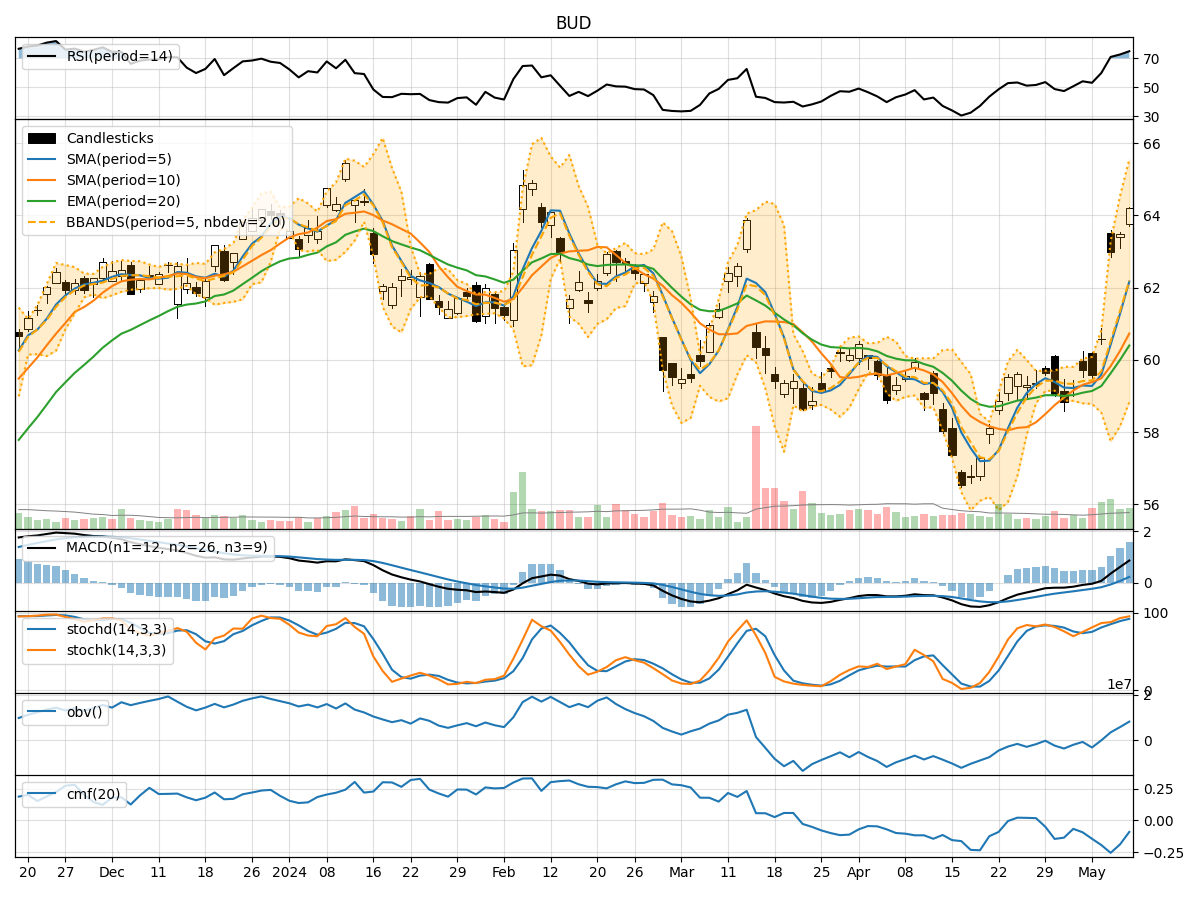
In analyzing the technical indicators for BUD stock over the last 5 days, we will delve into the trend, momentum, volatility, and volume indicators to provide a comprehensive outlook on the possible stock price movement in the coming days.
Trend Analysis:
- Moving Averages (MA): The 5-day Moving Average (MA) has been relatively stable around the $59 level, indicating a neutral trend.
- MACD: The MACD line has been consistently below the signal line, suggesting a bearish momentum in the short term.
- EMA: The Exponential Moving Average (EMA) has shown a slight downward trend, indicating potential weakness in the stock price.
Momentum Analysis:
- RSI: The Relative Strength Index (RSI) has been fluctuating around the mid-level, indicating indecision in the market.
- Stochastic Oscillator: Both %K and %D have been declining, signaling a potential bearish momentum.
- Williams %R: The Williams %R is hovering near oversold territory, suggesting a possible reversal in the short term.
Volatility Analysis:
- Bollinger Bands (BB): The Bollinger Bands have been narrowing, indicating decreasing volatility in the stock price.
- BB %B: The %B indicator is below 1, suggesting the stock is trading below the upper Bollinger Band, potentially indicating a bearish signal.
Volume Analysis:
- On-Balance Volume (OBV): The OBV has been declining, indicating selling pressure in the stock.
- Chaikin Money Flow (CMF): The CMF has been negative, suggesting outflow of money from the stock.
Key Observations:
- The trend indicators show a neutral to slightly bearish outlook.
- Momentum indicators suggest a potential bearish momentum in the short term.
- Volatility indicators point towards decreasing volatility.
- Volume indicators indicate selling pressure and outflow of money from the stock.
Conclusion:
Based on the analysis of the technical indicators, the overall outlook for BUD stock in the next few days is bearish. The trend is neutral to slightly bearish, momentum is indicating a potential bearish move, volatility is decreasing, and volume indicators show selling pressure. Therefore, it is likely that the stock price may experience a downward movement in the coming days. Traders and investors should exercise caution and consider implementing risk management strategies in their positions.