Technical Analysis of BSBR 2024-05-10
Overview:
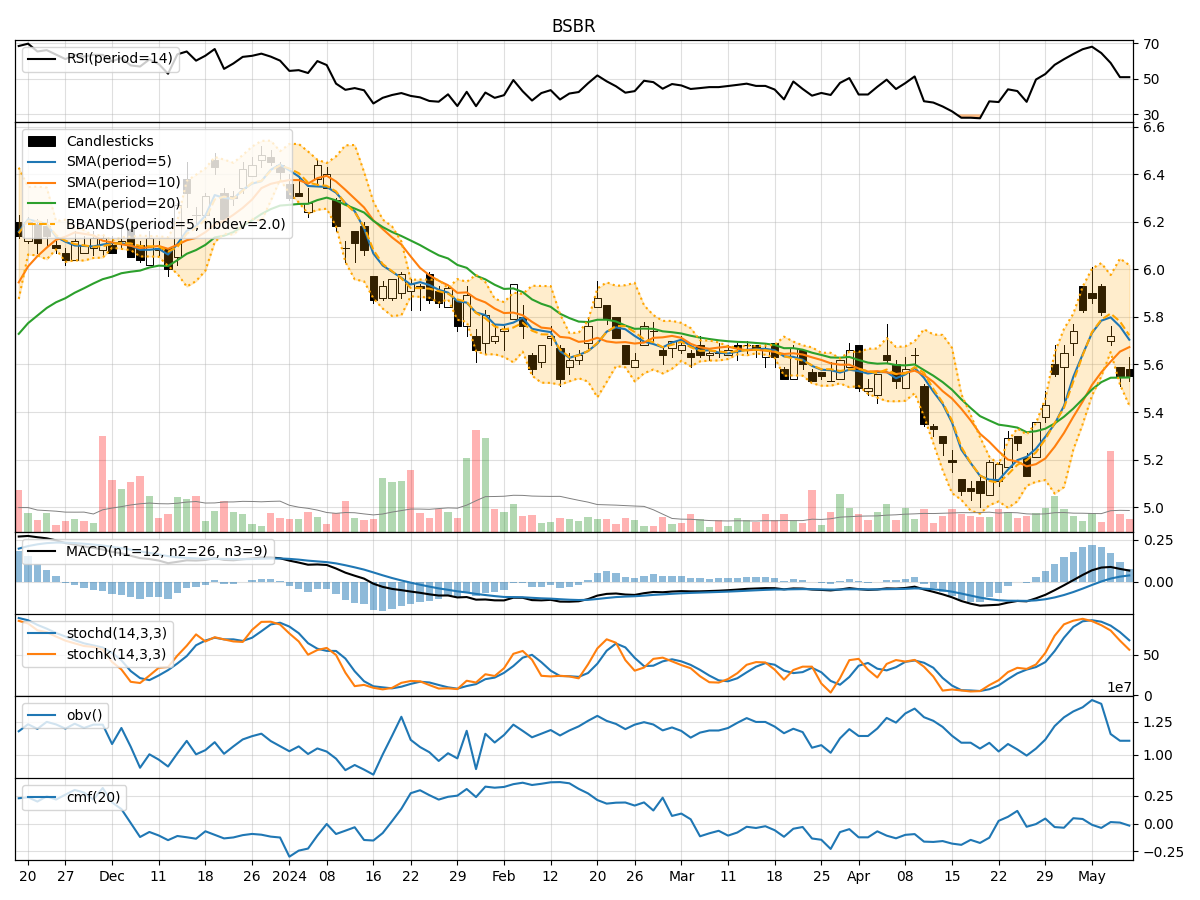
In analyzing the technical indicators for BSBR over the last 5 days, we will delve into the trend, momentum, volatility, and volume indicators to provide a comprehensive outlook on the possible stock price movement in the coming days.
Trend Analysis:
- Moving Averages (MA): The 5-day Moving Average (MA) has been fluctuating around the Simple Moving Average (SMA) and Exponential Moving Average (EMA) values, indicating a lack of clear trend direction.
- MACD: The Moving Average Convergence Divergence (MACD) has shown positive values, suggesting a potential bullish momentum.
- Conclusion: The trend indicators are showing mixed signals with a slight bullish bias.
Momentum Analysis:
- RSI: The Relative Strength Index (RSI) has been declining, indicating a weakening momentum.
- Stochastic Oscillator: Both %K and %D values have been decreasing, signaling a bearish momentum.
- Conclusion: Momentum indicators are pointing towards a bearish sentiment.
Volatility Analysis:
- Bollinger Bands (BB): The Bollinger Bands have been narrowing, indicating decreasing volatility.
- Conclusion: Volatility indicators suggest a decrease in price fluctuations.
Volume Analysis:
- On-Balance Volume (OBV): The OBV has been fluctuating, showing indecision in volume accumulation.
- Chaikin Money Flow (CMF): The CMF has been hovering around zero, indicating a balance between buying and selling pressure.
- Conclusion: Volume indicators reflect a lack of clear direction in volume accumulation.
Key Observations:
- The trend indicators show a slight bullish bias, while momentum indicators point towards a bearish sentiment.
- Volatility is decreasing, indicating a potential stabilization in price movements.
- Volume indicators suggest indecision in volume accumulation, reflecting a lack of strong buying or selling pressure.
Conclusion:
Based on the analysis of the technical indicators, the next few days for BSBR stock price movement are likely to be sideways with a slight bullish bias. However, the bearish momentum indicated by the momentum indicators could lead to short-term downward pressure. Traders should exercise caution and closely monitor key support and resistance levels for potential entry or exit points.
Recommendation:
- Short-term Traders: Consider waiting for more clarity in price direction before taking new positions.
- Long-term Investors: Monitor the developments closely and consider potential entry points during price dips for a favorable risk-reward ratio.
Always remember to conduct further research and consider fundamental factors before making any investment decisions.