Technical Analysis of BSAC 2024-05-10
Overview:
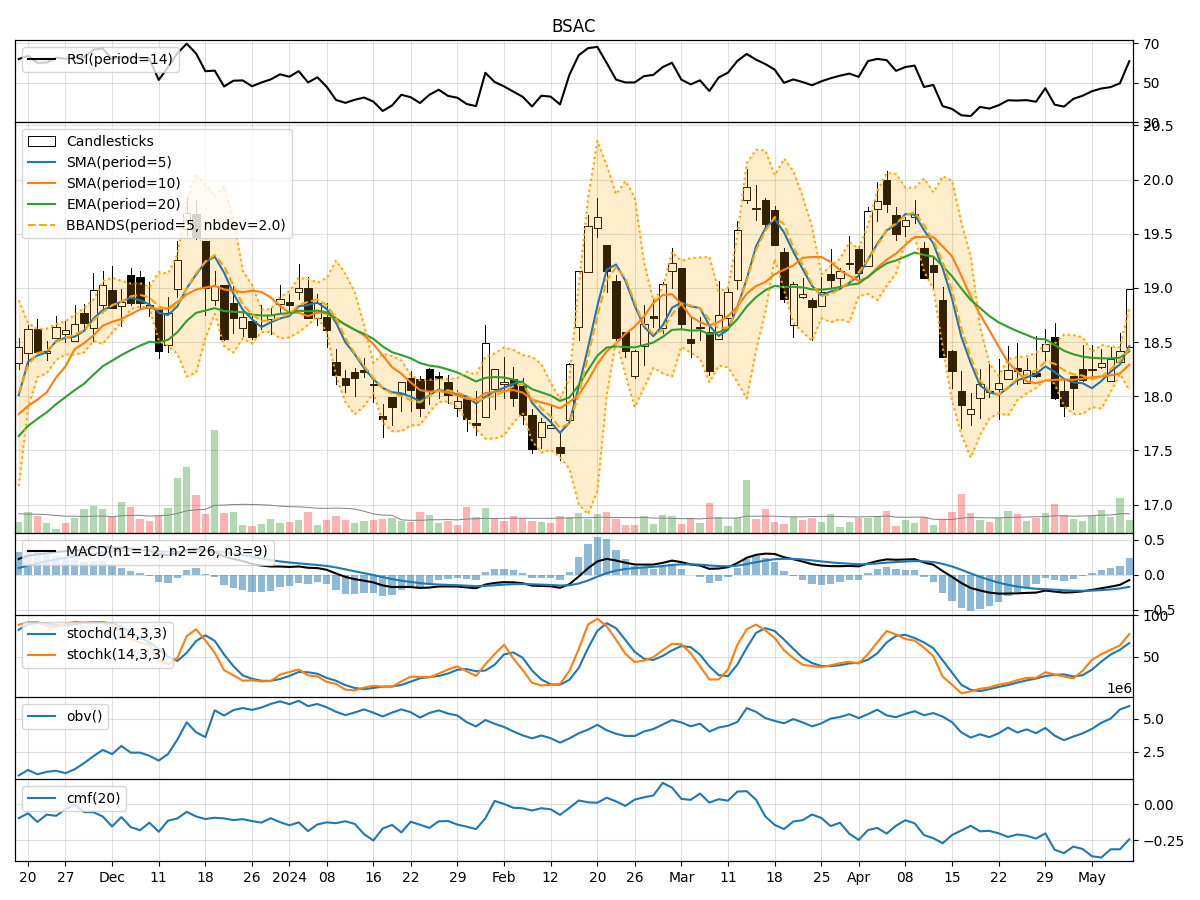
In analyzing the technical indicators for BSAC over the last 5 days, we will delve into the trend, momentum, volatility, and volume indicators to provide a comprehensive outlook on the possible stock price movement. By examining these key aspects, we aim to offer valuable insights and predictions for the upcoming days.
Trend Indicators:
- Moving Averages (MA): The 5-day MA has been showing an upward trend, indicating a positive momentum in the stock price.
- MACD: The MACD line has been consistently below the signal line, suggesting a bearish trend in the short term.
- EMA: The EMA has been relatively stable, indicating a potential consolidation phase in the stock price.
Momentum Indicators:
- RSI: The RSI has been gradually increasing, signaling a strengthening momentum in the stock.
- Stochastic Oscillator: Both %K and %D have been rising, indicating increasing buying pressure.
- Williams %R: The indicator has moved towards oversold territory, suggesting a potential reversal in the stock price.
Volatility Indicators:
- Bollinger Bands: The bands have widened, indicating increased volatility in the stock price.
- Bollinger %B: The %B is close to 1, suggesting the stock is trading near the upper band, potentially overbought.
Volume Indicators:
- On-Balance Volume (OBV): The OBV has been steadily increasing, indicating accumulation by investors.
- Chaikin Money Flow (CMF): The CMF has been negative, suggesting selling pressure in the stock.
Key Observations:
- The stock is currently in an uptrend based on moving averages, but the MACD indicates a short-term bearish trend.
- Momentum indicators show a mixed signal with RSI indicating strength, while Williams %R suggests a potential reversal.
- Volatility has increased, indicating potential price swings, and the stock is trading near the upper Bollinger Band.
- Volume indicators show accumulation based on OBV, but CMF indicates selling pressure.
Conclusion:
Based on the analysis of the technical indicators, the next few days' possible stock price movement for BSAC is likely to experience a short-term correction or consolidation. The conflicting signals from the trend, momentum, and volume indicators suggest a period of uncertainty in the stock price. Traders should exercise caution and closely monitor key levels for potential entry or exit points. Overall, the outlook is neutral with a slight bearish bias in the short term.