Technical Analysis of BMI 2024-05-10
Overview:
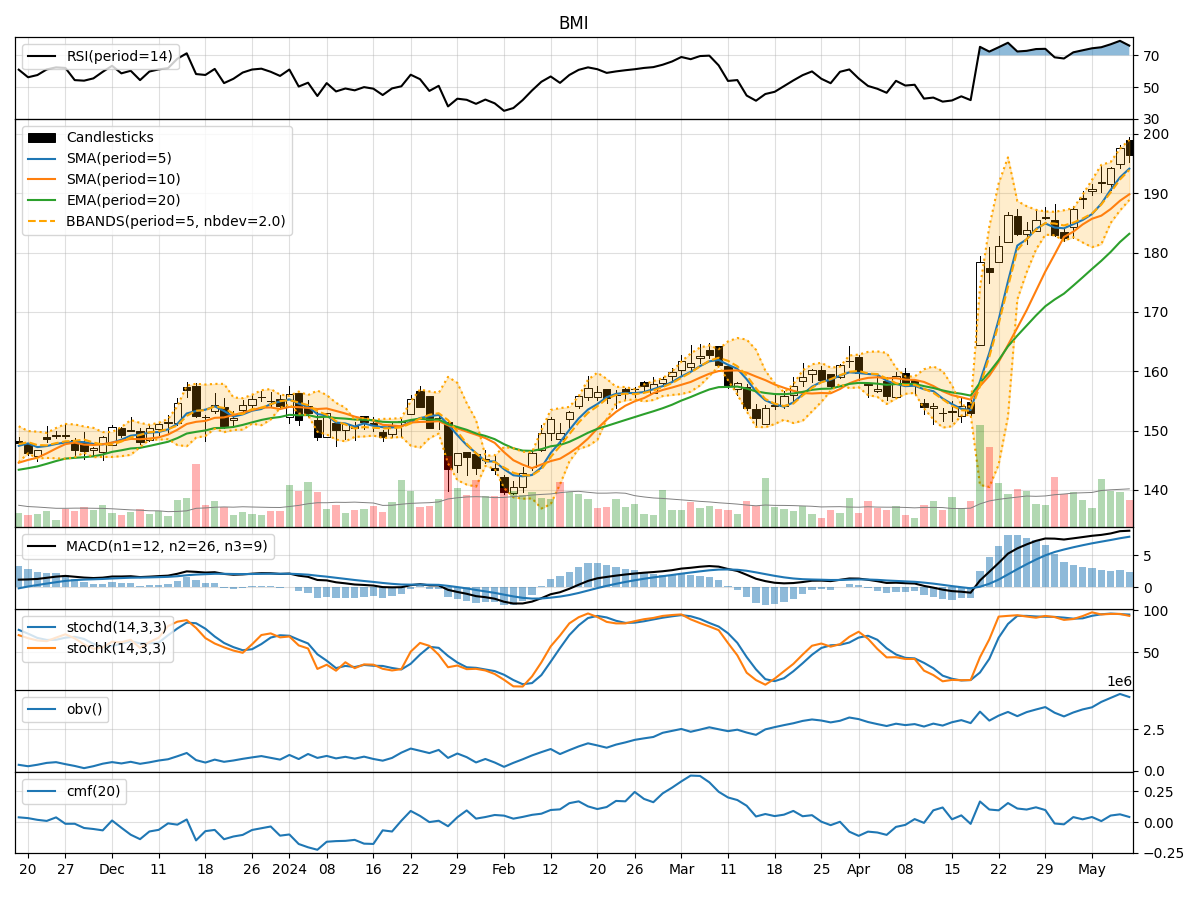
In the last 5 trading days, BMI stock has shown a consistent uptrend in both price and volume. The moving averages have been steadily increasing, indicating a bullish trend. Momentum indicators like RSI and Stochastic oscillators suggest the stock is in overbought territory but still have room for further upside. Volatility indicators show that the stock price has been trading within the Bollinger Bands, with the upper band acting as a resistance level. Volume indicators confirm the buying pressure in the stock.
Trend Indicators Analysis:
- Moving Averages (MA): The 5-day MA has been consistently above the longer-term SMAs, indicating a strong bullish trend.
- MACD: The MACD line has been above the signal line, indicating bullish momentum.
- MACD Histogram: The histogram has been positive, showing increasing bullish momentum.
Key Observation: The trend indicators suggest a strong bullish momentum in BMI stock.
Momentum Indicators Analysis:
- RSI: The RSI has been in overbought territory, indicating a potential reversal or consolidation.
- Stochastic Oscillators: Both %K and %D have been high, suggesting the stock is overbought.
- Williams %R: The stock has been in oversold territory, indicating a potential reversal.
Key Observation: Momentum indicators suggest that the stock may experience a short-term pullback or consolidation.
Volatility Indicators Analysis:
- Bollinger Bands: The stock price has been trading within the bands, with the upper band acting as a resistance level.
- Bollinger %B: The %B indicator is below 1, indicating the stock is trading below the upper band.
Key Observation: Volatility indicators suggest that the stock is currently at a resistance level and may experience a price consolidation.
Volume Indicators Analysis:
- On-Balance Volume (OBV): The OBV has been steadily increasing, confirming the buying pressure in the stock.
- Chaikin Money Flow (CMF): The CMF has been positive, indicating strong buying pressure.
Key Observation: Volume indicators confirm the bullish trend in BMI stock.
Conclusion:
Based on the analysis of the technical indicators, the next few days for BMI stock are likely to see a short-term pullback or consolidation. The stock has been in overbought territory according to momentum indicators, and the price is currently at a resistance level based on volatility indicators. However, the overall trend remains bullish, supported by strong volume indicators. Traders may consider taking profits or waiting for a better entry point during the anticipated consolidation phase.