Technical Analysis of BMA 2024-05-10
Overview:
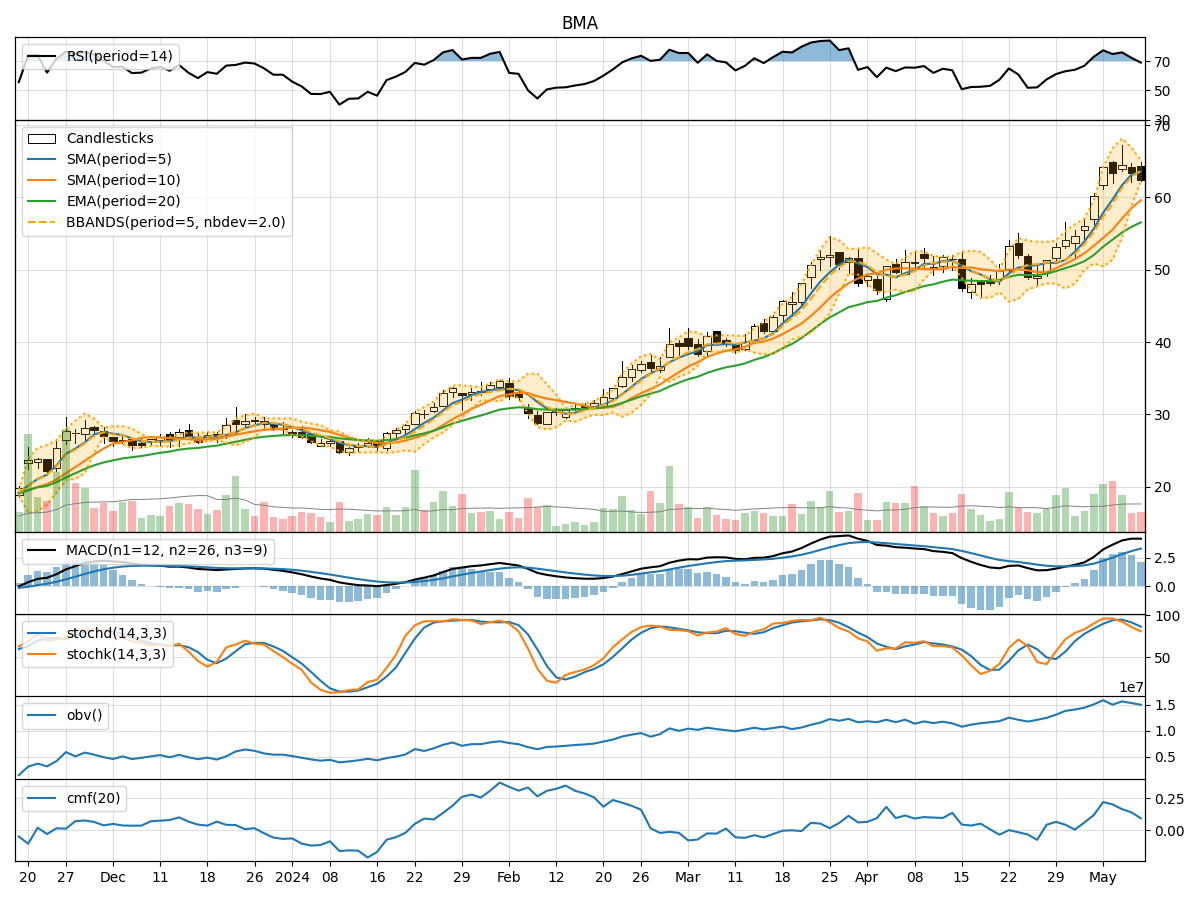
In analyzing the technical indicators for BMA over the last 5 days, we will delve into the trend, momentum, volatility, and volume indicators to provide a comprehensive outlook on the possible stock price movement in the coming days. By examining these key indicators, we aim to offer valuable insights and recommendations for potential investors.
Trend Analysis:
- Moving Averages (MA): The 5-day Moving Average (MA) has been consistently increasing, indicating a bullish trend in the short term.
- MACD: The Moving Average Convergence Divergence (MACD) has shown positive values, suggesting a bullish momentum in the stock price.
- EMA: The Exponential Moving Average (EMA) has been on an upward trajectory, supporting the bullish trend.
Momentum Analysis:
- RSI: The Relative Strength Index (RSI) has been relatively high, indicating overbought conditions in the stock.
- Stochastic Oscillator: Both %K and %D have been decreasing, signaling a potential reversal in momentum.
- Williams %R: The Williams %R is in the oversold territory, suggesting a possible upcoming price correction.
Volatility Analysis:
- Bollinger Bands: The Bollinger Bands have been narrowing, indicating decreasing volatility in the stock price.
- Bollinger %B: The %B indicator is approaching the lower band, suggesting a potential buying opportunity.
- Average True Range (ATR): The ATR has been decreasing, indicating lower price volatility.
Volume Analysis:
- On-Balance Volume (OBV): The OBV has been fluctuating, indicating indecision among investors.
- Chaikin Money Flow (CMF): The CMF has been positive but decreasing, suggesting a potential outflow of money from the stock.
Conclusion:
Based on the analysis of the technical indicators, the stock of BMA is likely to experience sideways consolidation in the coming days. The bullish trend indicated by moving averages and MACD may face resistance due to overbought conditions highlighted by RSI and potential momentum reversal shown by the Stochastic Oscillator. The decreasing volatility and fluctuating volume further support the view of a sideways movement.
Recommendation:
- Short-term Traders: Consider taking profits or implementing tight stop-loss orders due to the overbought conditions.
- Long-term Investors: Monitor the stock closely for a potential entry point during price corrections.
- Risk Management: Exercise caution and wait for clearer signals before making significant investment decisions.
By combining insights from trend, momentum, volatility, and volume indicators, investors can make informed decisions aligned with the current market dynamics of BMA.