Technical Analysis of BF.B 2024-05-10
Overview:
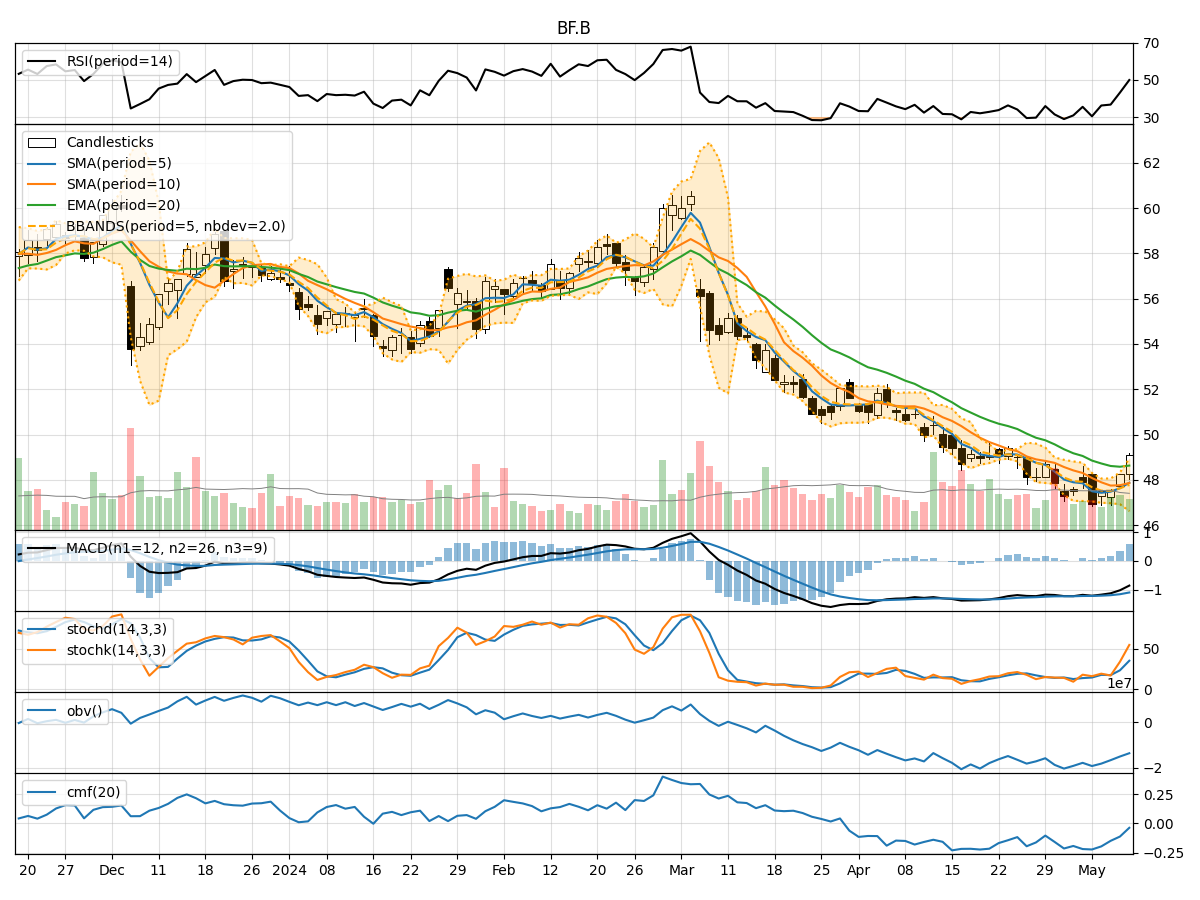
In analyzing the technical indicators for BF.B over the last 5 days, we will delve into the trend, momentum, volatility, and volume indicators to provide a comprehensive outlook on the possible stock price movement in the coming days. By examining these key aspects, we aim to offer valuable insights and predictions to guide investment decisions.
Trend Analysis:
- Moving Averages (MA): The 5-day MA has been fluctuating around the actual closing prices, indicating a lack of clear trend direction.
- MACD: The MACD line has been negative, but the MACD histogram has shown a slight increase, suggesting a potential shift towards a bullish momentum.
Momentum Analysis:
- RSI: The RSI has been gradually increasing, indicating strengthening momentum.
- Stochastic Oscillator: Both %K and %D have been rising, signifying increasing buying pressure.
Volatility Analysis:
- Bollinger Bands (BB): The stock price has been consistently trading above the middle Bollinger Band, suggesting a bullish sentiment.
Volume Analysis:
- On-Balance Volume (OBV): The OBV has been declining, indicating a decrease in buying volume.
- Chaikin Money Flow (CMF): The CMF has been negative, reflecting a lack of buying pressure.
Key Observations:
- The trend indicators show a potential shift towards a bullish momentum.
- Momentum indicators signal increasing buying pressure and strengthening momentum.
- Volatility indicators suggest a bullish sentiment with the stock price consistently above the middle Bollinger Band.
- Volume indicators, however, indicate a decrease in buying volume, which could potentially limit the extent of price movements.
Conclusion:
Based on the analysis of the technical indicators, the overall outlook for BF.B in the next few days leans towards an upward trend. The bullish signals from the trend and momentum indicators, coupled with the positive sentiment indicated by the volatility indicators, suggest a potential for further price appreciation. However, the declining OBV and negative CMF raise some concerns about the sustainability of this upward movement. Therefore, investors should closely monitor volume trends to confirm the strength of the bullish momentum.