Technical Analysis of BEST 2024-05-10
Overview:
In analyzing the technical indicators for the stock over the last 5 days, we will delve into the trend, momentum, volatility, and volume indicators to provide a comprehensive assessment of the possible future stock price movement. By examining these key indicators, we aim to offer valuable insights and predictions for the upcoming trading days.
Trend Indicators:
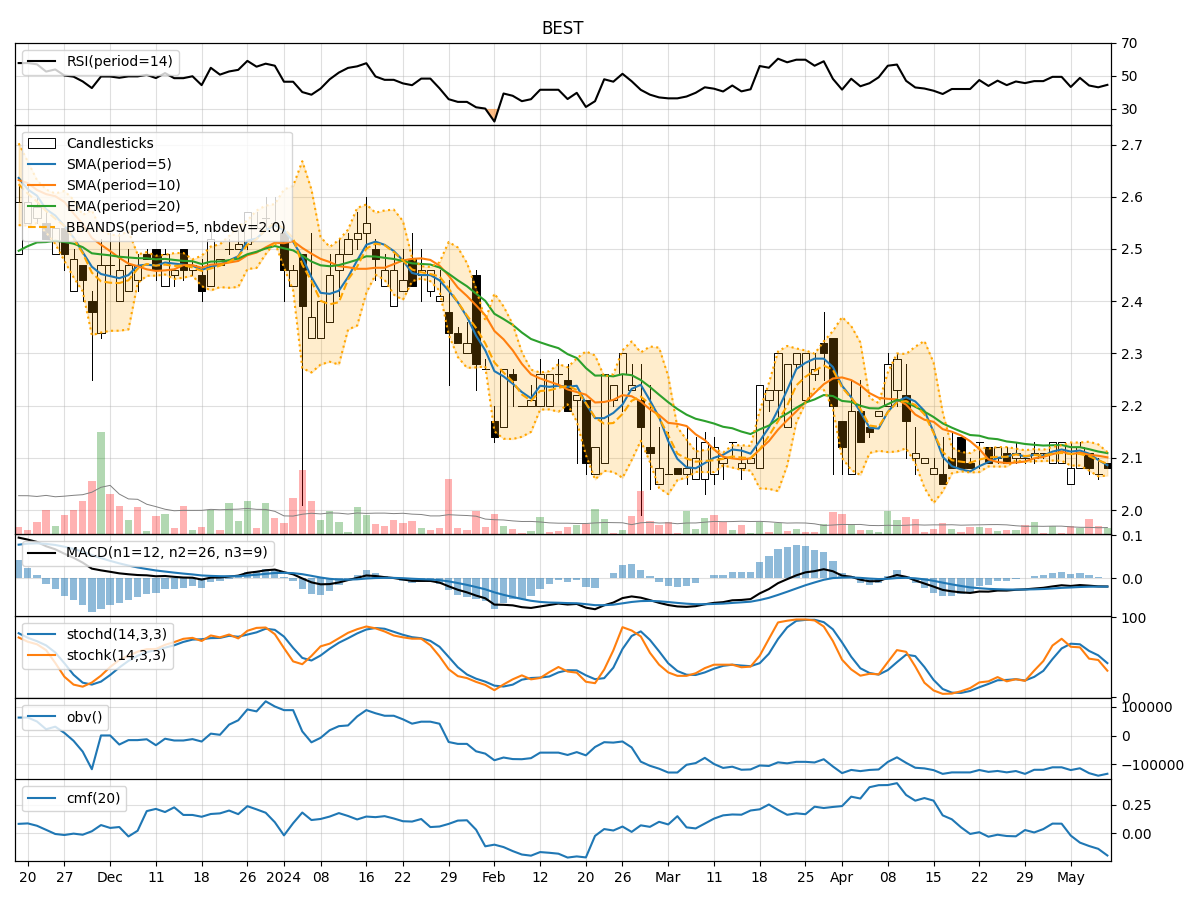
- Moving Averages (MA): The 5-day Moving Average (MA) has been fluctuating around the current stock price, indicating a lack of clear trend direction.
- MACD and Signal Line: The MACD has been consistently negative, suggesting a bearish momentum in the short term.
- MACD Histogram: The MACD Histogram has been decreasing slightly, indicating a weakening bearish momentum.
Momentum Indicators:
- RSI (Relative Strength Index): The RSI has been hovering around the mid-range, indicating a neutral momentum with no clear overbought or oversold conditions.
- Stochastic Oscillator: Both %K and %D lines of the Stochastic Oscillator have been declining, signaling a bearish momentum.
- Williams %R (Willams Percentage Range): The Williams %R has been consistently in the oversold territory, suggesting a bearish sentiment.
Volatility Indicators:
- Bollinger Bands (BB): The Bollinger Bands have been narrowing, indicating decreasing volatility in the stock price.
- Bollinger Band %B: The %B indicator has been fluctuating within a narrow range, reflecting the consolidation phase in the stock.
- Bollinger Band Width: The Band Width has been decreasing, further confirming the reduced volatility in the stock.
Volume Indicators:
- On-Balance Volume (OBV): The OBV has been consistently negative, indicating a higher selling pressure in the stock.
- Chaikin Money Flow (CMF): The CMF has been in the negative territory, suggesting a bearish sentiment in the stock.
Conclusion:
Based on the analysis of the technical indicators, the stock is currently exhibiting a bearish outlook. The trend indicators show a lack of clear direction, with a slightly bearish bias in the short term. Momentum indicators confirm the bearish sentiment, with both Stochastic and Williams %R signaling a downward momentum. Volatility indicators suggest reduced volatility and a consolidation phase in the stock price.
Considering the negative OBV and CMF values, along with the overall bearish tone of the indicators, it is likely that the stock will experience further downward movement in the next few trading days. Traders and investors should exercise caution and consider short-term selling strategies or wait for a more favorable entry point before considering long positions.