Technical Analysis of BEKE 2024-05-10
Overview:
In analyzing the technical indicators for BEKE over the last 5 days, we will delve into the trend, momentum, volatility, and volume indicators to provide a comprehensive outlook on the possible stock price movement. By examining these key aspects, we aim to offer valuable insights and recommendations for potential future price action.
Trend Analysis:
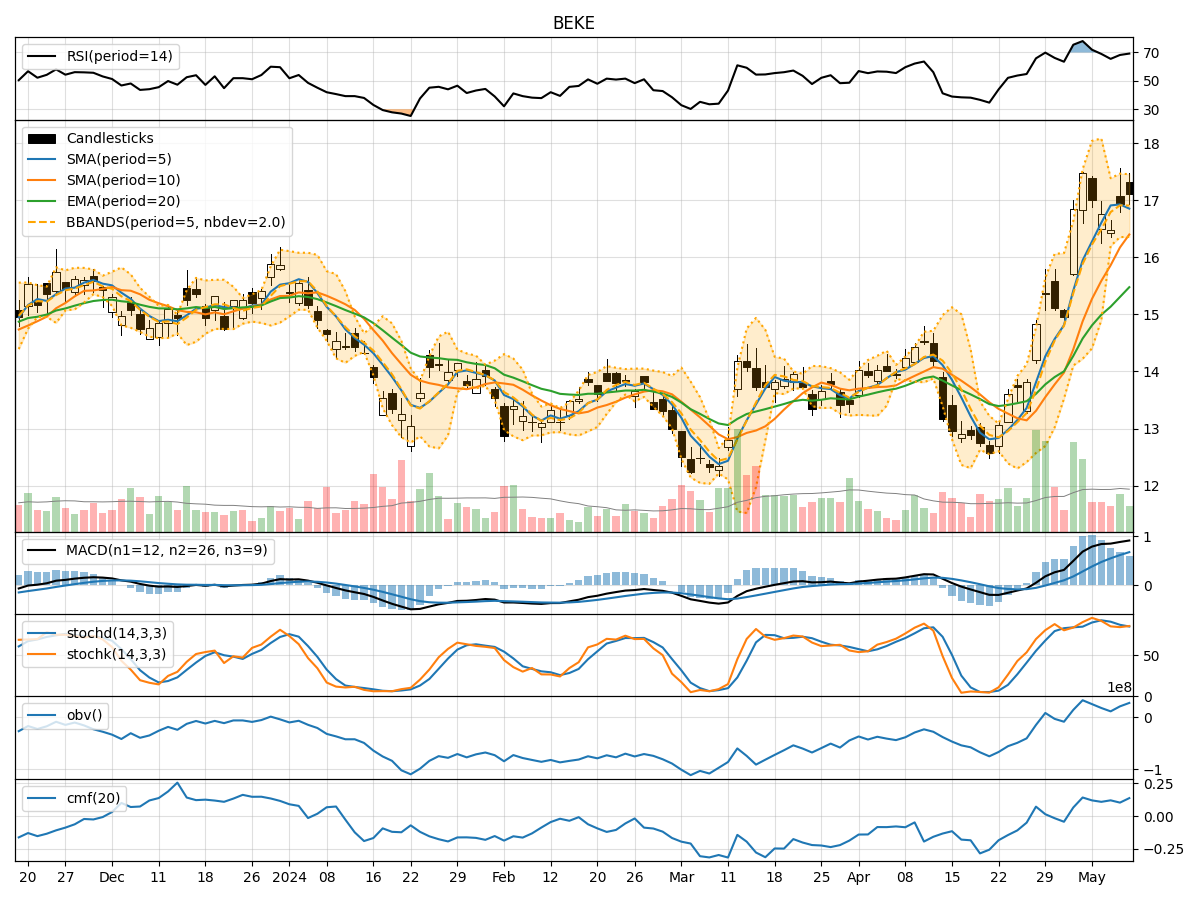
- Moving Averages (MA): The 5-day Moving Average (MA) has been consistently above the Simple Moving Average (SMA) and Exponential Moving Average (EMA), indicating a bullish trend.
- MACD: The MACD line has been above the signal line, with both lines showing an upward trend, suggesting bullish momentum.
- RSI: The Relative Strength Index (RSI) has been above 50, indicating bullish momentum in the stock.
Key Observation: The trend indicators suggest a strong bullish sentiment in the stock.
Momentum Analysis:
- Stochastic Oscillator: The Stochastic Oscillator has been consistently above 80, indicating overbought conditions but also strong upward momentum.
- Williams %R: The Williams %R has been consistently below -20, indicating overbought conditions and a potential reversal.
Key Observation: Momentum indicators suggest a potential short-term pullback due to overbought conditions.
Volatility Analysis:
- Bollinger Bands: The stock price has been consistently trading above the upper Bollinger Band, indicating overbought conditions and potential for a reversal.
- Volatility Percentage: The volatility percentage has been increasing, suggesting higher price fluctuations.
Key Observation: Volatility indicators point towards a potential reversal or correction in the stock price.
Volume Analysis:
- On-Balance Volume (OBV): The OBV has been showing a mixed trend, indicating indecision among investors.
- Chaikin Money Flow (CMF): The CMF has been fluctuating around the zero line, suggesting a lack of strong buying or selling pressure.
Key Observation: Volume indicators reflect a neutral stance with no clear direction in investor sentiment.
Conclusion:
Based on the analysis of the technical indicators, the stock of BEKE is currently exhibiting overbought conditions and strong bullish momentum. However, the increasing volatility and potential for a short-term pullback indicated by momentum and volatility indicators suggest a possible correction or consolidation in the stock price in the coming days.
Recommendation: Considering the overbought conditions and mixed signals from volume indicators, investors should exercise caution and consider potential profit-taking or implementing risk management strategies in anticipation of a short-term correction in the stock price.