Technical Analysis of BCE 2024-05-10
Overview:
In analyzing the technical indicators for BCE over the last 5 days, we will delve into the trend, momentum, volatility, and volume indicators to provide a comprehensive outlook on the possible stock price movement. By examining these key indicators, we aim to offer valuable insights and predictions for the upcoming days.
Trend Indicators:
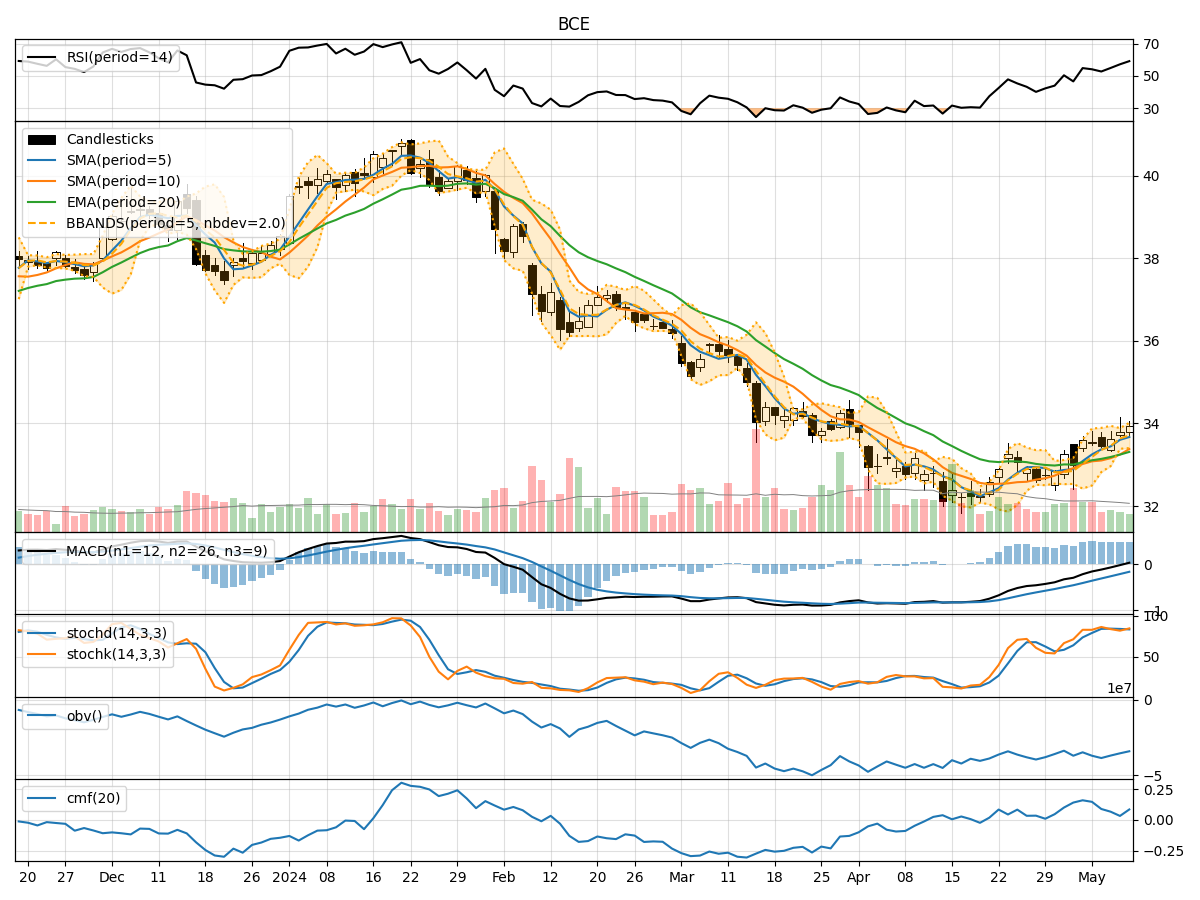
- Moving Averages (MA): The 5-day Moving Average has been consistently above the Simple Moving Average (SMA) and Exponential Moving Average (EMA), indicating a short-term uptrend.
- MACD: The MACD line has been above the signal line for the past few days, suggesting bullish momentum.
- MACD Histogram: The MACD Histogram has been increasing, indicating strengthening bullish momentum.
Momentum Indicators:
- RSI: The Relative Strength Index (RSI) has been trending upwards, indicating increasing buying pressure.
- Stochastic Oscillator: Both %K and %D lines of the Stochastic Oscillator have been in the overbought zone, suggesting a potential reversal.
- Williams %R: The Williams %R is in the oversold region, indicating a possible buying opportunity.
Volatility Indicators:
- Bollinger Bands: The stock price has been trading within the Bollinger Bands, suggesting a period of consolidation.
- Bollinger %B: The %B indicator is hovering around 0.8, indicating a relatively high position within the bands.
Volume Indicators:
- On-Balance Volume (OBV): The OBV has been declining, indicating selling pressure in the stock.
- Chaikin Money Flow (CMF): The CMF has been positive but decreasing, suggesting weakening buying pressure.
Key Observations:
- The trend indicators point towards a bullish sentiment in the short term.
- Momentum indicators show conflicting signals with RSI indicating strength while Stochastic Oscillator and Williams %R suggest potential reversals.
- Volatility indicators imply a period of consolidation with no clear directional bias.
- Volume indicators indicate a decrease in buying pressure and potential selling interest.
Conclusion:
Based on the analysis of the technical indicators, the next few days for BCE stock price movement could be sideways with a slight bearish bias. While the trend indicators suggest a bullish outlook, conflicting signals from momentum indicators and weakening buying pressure indicated by volume indicators may lead to a period of consolidation. Traders should exercise caution and closely monitor key support and resistance levels for potential entry or exit points.