Technical Analysis of BBDO 2024-05-10
Overview:
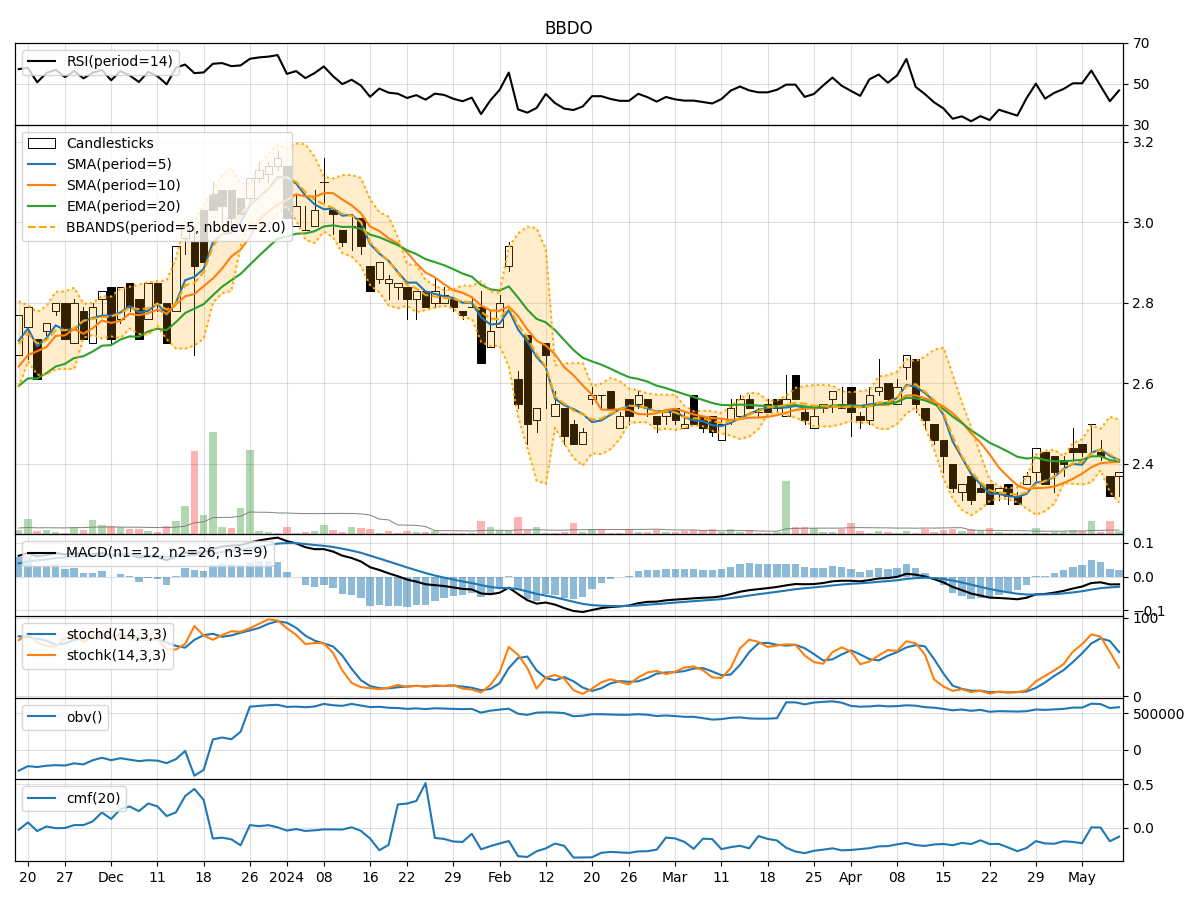
In analyzing the technical indicators for BBDO over the last 5 days, we will delve into the trend, momentum, volatility, and volume indicators to provide a comprehensive outlook on the possible stock price movement. By examining these key aspects, we aim to offer valuable insights and predictions for the upcoming days.
Trend Analysis:
- Moving Averages (MA): The 5-day Moving Average (MA) has been fluctuating around the closing prices, indicating short-term price trends.
- MACD: The Moving Average Convergence Divergence (MACD) has been negative, suggesting a bearish momentum in the stock.
- EMA: The Exponential Moving Average (EMA) has been relatively stable, reflecting a smoother trend line.
Key Observation: The trend indicators show mixed signals with a slight bearish bias due to the negative MACD.
Momentum Analysis:
- RSI: The Relative Strength Index (RSI) has been oscillating around the 50 level, indicating a neutral momentum.
- Stochastic Oscillator: Both %K and %D have been declining, signaling a bearish momentum.
- Williams %R: The Williams %R has been in oversold territory, suggesting a potential reversal.
Key Observation: Momentum indicators point towards a bearish sentiment with potential for a reversal based on the Williams %R.
Volatility Analysis:
- Bollinger Bands (BB): The Bollinger Bands have been narrowing, indicating decreasing volatility.
- Bollinger %B: The %B indicator has been hovering around the midline, reflecting a balanced volatility level.
Key Observation: Volatility has been decreasing, suggesting a period of consolidation or potential price stability.
Volume Analysis:
- On-Balance Volume (OBV): The OBV has shown mixed movements, indicating indecision among market participants.
- Chaikin Money Flow (CMF): The CMF has been negative, suggesting outflow of money from the stock.
Key Observation: Volume indicators reflect uncertainty in market participation and a slight bearish sentiment.
Conclusion:
Based on the analysis of the technical indicators, the stock price of BBDO is likely to experience further downward movement in the next few days. The trend indicators show a bearish bias, supported by the negative MACD. Momentum indicators also align with the bearish view, although there is a possibility of a reversal indicated by the oversold condition in the Williams %R. Volatility is decreasing, pointing towards a period of consolidation, while volume indicators suggest a lack of strong buying interest.
Overall, the outlook for BBDO is bearish in the short term, with potential for a reversal if momentum shifts. Traders should exercise caution and consider waiting for clearer signals before making any significant trading decisions.