Technical Analysis of BAC 2024-05-10
Overview:
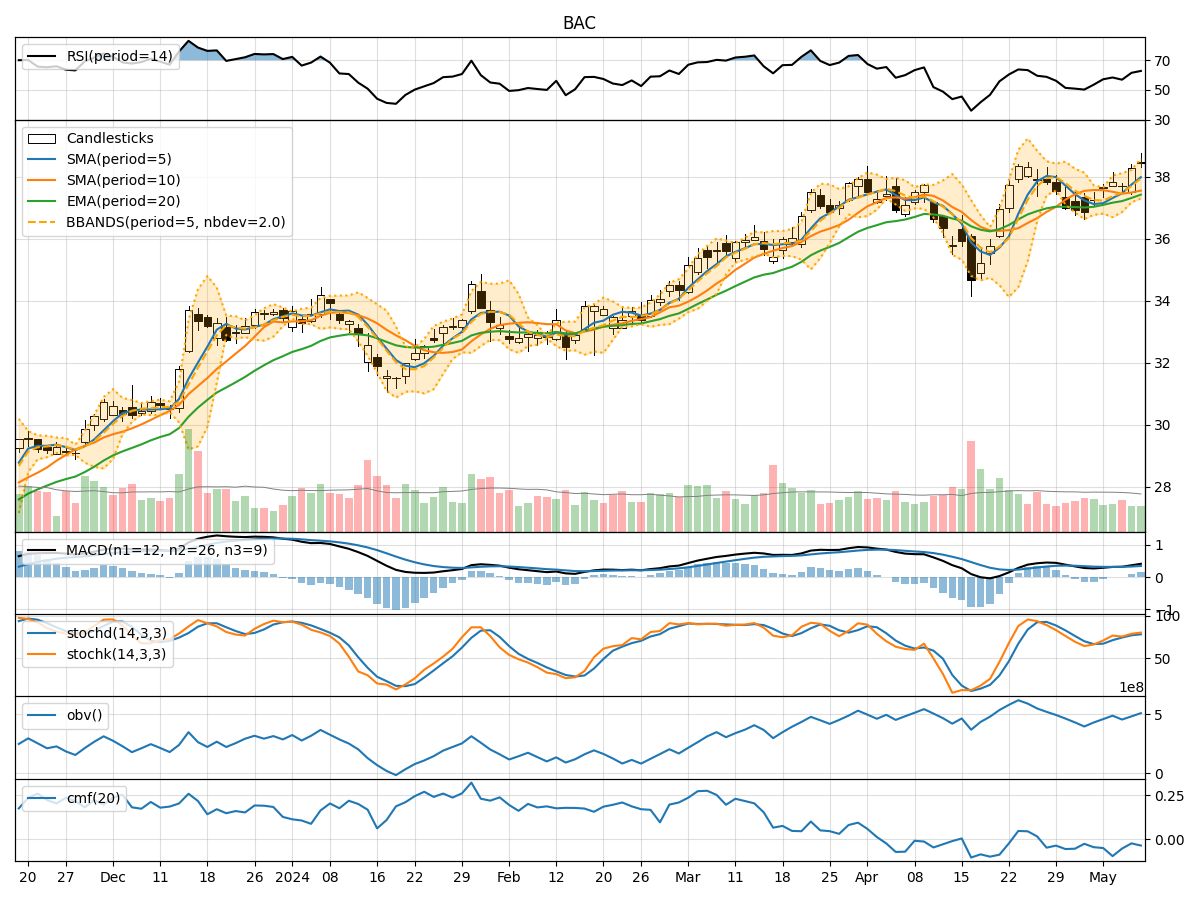
In the last 5 trading days, Bank of America (BAC) stock has shown a mix of price movements and technical indicators. We will analyze the trend, momentum, volatility, and volume indicators to provide insights into the possible future stock price movement of BAC.
Trend Analysis:
- Moving Averages (MA): The 5-day Moving Average (MA) has been trending upwards, indicating a short-term positive momentum in the stock price.
- MACD: The MACD line has been consistently above the signal line, suggesting a bullish trend in the stock.
- EMA: The Exponential Moving Average (EMA) has been steadily increasing, supporting the bullish sentiment in the stock.
Key Observation: The trend indicators point towards an upward movement in the stock price.
Momentum Analysis:
- RSI: The Relative Strength Index (RSI) has been increasing, indicating strengthening momentum in the stock.
- Stochastic Oscillator: Both %K and %D lines of the Stochastic Oscillator are in the overbought zone, suggesting a potential reversal or consolidation.
- Williams %R: The Williams %R is in the oversold territory, indicating a possible reversal in the short term.
Key Observation: The momentum indicators show a mixed signal, with potential for a short-term correction or consolidation.
Volatility Analysis:
- Bollinger Bands: The Bollinger Bands are widening, indicating increased volatility in the stock price.
- Bollinger %B: The %B value is fluctuating around 1, suggesting the stock is trading close to the upper band.
Key Observation: The volatility indicators suggest increased volatility in the stock price.
Volume Analysis:
- On-Balance Volume (OBV): The OBV has been fluctuating, indicating indecision among investors.
- Chaikin Money Flow (CMF): The CMF is negative, suggesting outflow of money from the stock.
Key Observation: The volume indicators reflect mixed sentiment among investors.
Conclusion:
Based on the analysis of the technical indicators: - Trend: The trend indicators suggest an upward movement in the stock price. - Momentum: The momentum indicators show a mixed signal, indicating a potential for short-term correction or consolidation. - Volatility: The volatility indicators point towards increased volatility in the stock price. - Volume: The volume indicators reflect mixed sentiment among investors.
Overall Assessment:
Considering the overall analysis, the stock of BAC is likely to experience increased volatility in the short term. While the trend indicators are bullish, the mixed signals from momentum and volume indicators suggest a potential for consolidation or short-term correction. Traders should closely monitor key support and resistance levels for better entry and exit points.
Recommendation:
- Short-Term Traders: Consider taking profits or tightening stop-loss levels due to the mixed momentum signals.
- Long-Term Investors: Hold positions with a focus on key support levels for potential buying opportunities.
Overall View: The stock of BAC is likely to experience short-term consolidation with a bullish bias in the long term.