Technical Analysis of AZO 2024-05-10
Overview:
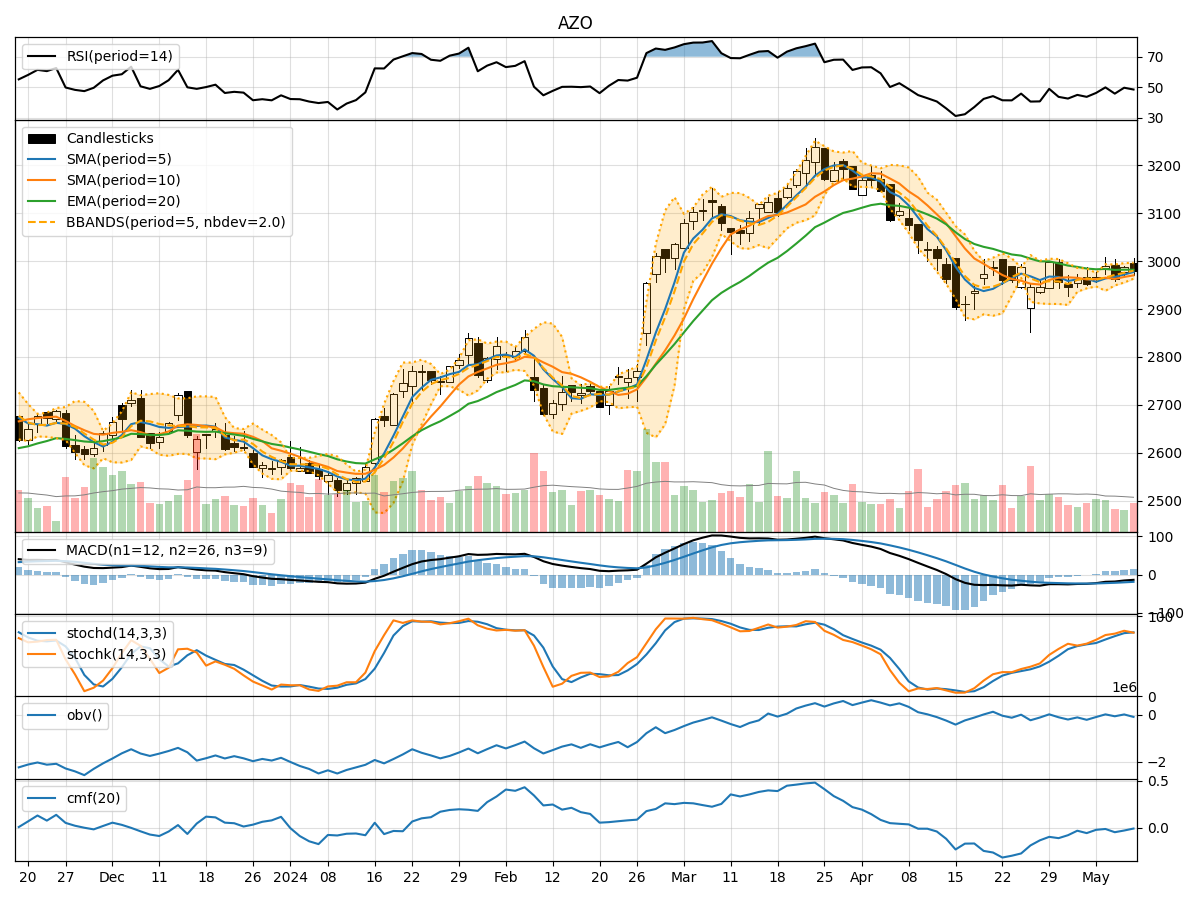
In analyzing the technical indicators for AZO over the last 5 days, we will delve into the trend, momentum, volatility, and volume indicators to provide a comprehensive outlook on the possible stock price movement in the coming days.
Trend Analysis:
- Moving Averages (MA): The 5-day MA has been fluctuating around the closing prices, indicating short-term price trends. The SMA(10) and EMA(20) have been relatively close to each other, suggesting stability in the medium-term trend.
- MACD: The MACD line has been consistently negative, indicating a bearish trend. However, the MACD Histogram has shown a slight increase, hinting at a potential reversal.
Momentum Analysis:
- RSI: The RSI has been hovering around the neutral zone, indicating a lack of strong momentum in either direction.
- Stochastic Oscillator: Both %K and %D have been in the overbought territory, suggesting a potential reversal or consolidation.
- Williams %R: The Williams %R has been fluctuating in the oversold region, indicating potential buying opportunities.
Volatility Analysis:
- Bollinger Bands (BB): The stock price has been trading within the Bollinger Bands, suggesting a period of consolidation. The bands have not shown significant expansion or contraction.
- Bollinger %B: The %B indicator has been relatively stable, indicating a lack of extreme price movements.
Volume Analysis:
- On-Balance Volume (OBV): The OBV has been fluctuating, indicating mixed buying and selling pressure.
- Chaikin Money Flow (CMF): The CMF has been negative, suggesting a lack of significant inflow of money into the stock.
Key Observations:
- The trend indicators show a potential reversal in the MACD Histogram.
- Momentum indicators suggest a lack of strong directional momentum.
- Volatility indicators point towards a period of consolidation.
- Volume indicators reflect mixed buying and selling pressure.
Conclusion:
Based on the analysis of the technical indicators, the stock price of AZO is likely to consolidate in the coming days. The lack of strong momentum, coupled with mixed signals from volume and volatility indicators, indicates a period of sideways movement. Traders may consider adopting a neutral stance and wait for clearer signals before making significant trading decisions.