Technical Analysis of AS 2024-05-10
Overview:
In analyzing the provided technical indicators for the last 5 days, we will delve into the trend, momentum, volatility, and volume indicators to forecast the possible stock price movement for the next few days. By examining these key aspects, we aim to provide a comprehensive and insightful prediction backed by data-driven analysis.
Trend Analysis:
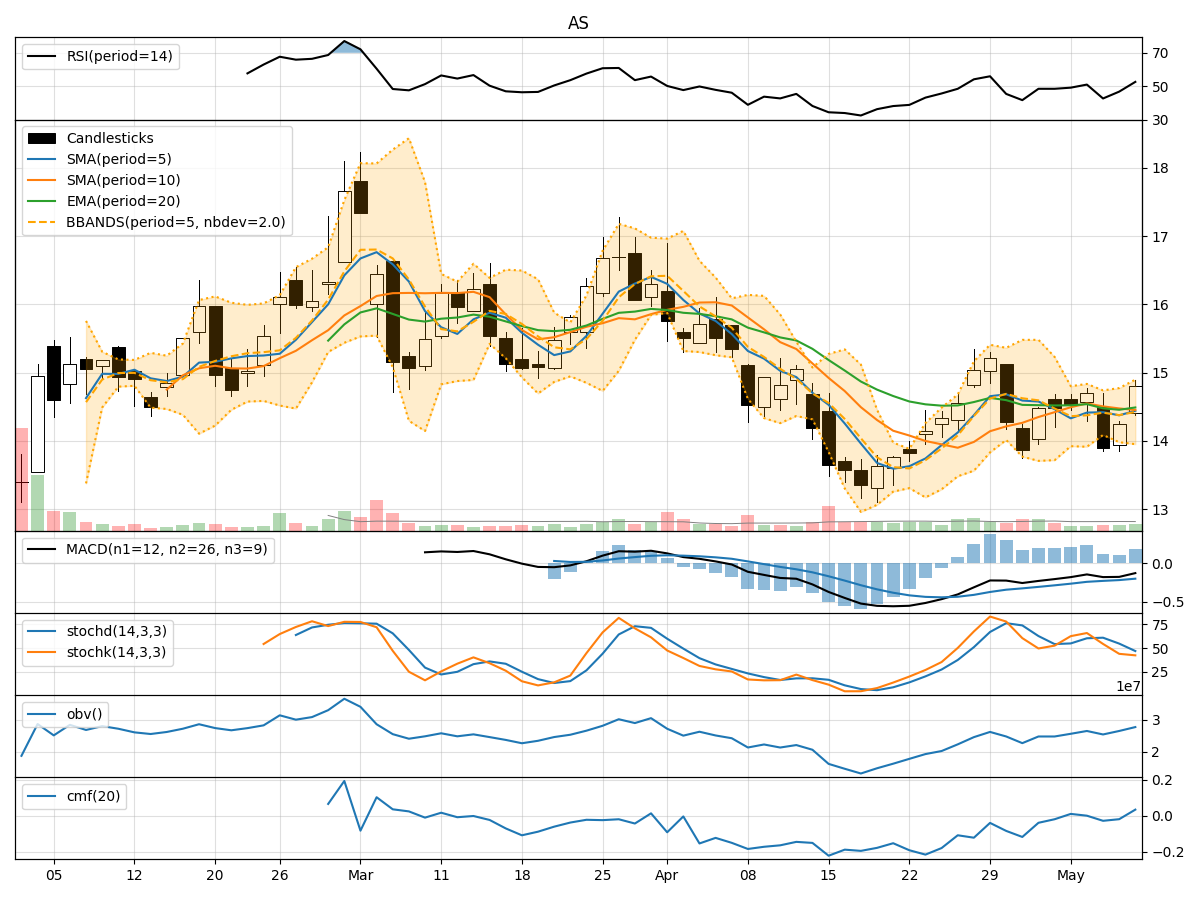
- Moving Averages (MA): The 5-day Moving Average (MA) has been fluctuating around the closing prices, indicating short-term price trends. The Simple Moving Average (SMA) and Exponential Moving Average (EMA) show a similar pattern, with slight variations.
- Moving Average Convergence Divergence (MACD): The MACD and Signal Line (MACDh) have been negative but showing signs of convergence, suggesting a potential shift in momentum.
Momentum Analysis:
- Relative Strength Index (RSI): The RSI values have been hovering around the mid-range, indicating a balanced momentum between buying and selling pressure.
- Stochastic Oscillator: Both %K and %D values have been fluctuating, reflecting indecision in the market sentiment.
- Williams %R (Willams %R): The Williams %R values have been oscillating, indicating potential overbought or oversold conditions.
Volatility Analysis:
- Bollinger Bands (BB): The Bollinger Bands have been narrowing, suggesting decreasing volatility in the stock price.
- Bollinger Band %B (BB %B): The %B values have been relatively stable, indicating a lack of extreme price movements.
Volume Analysis:
- On-Balance Volume (OBV): The OBV values have been mixed, indicating alternating buying and selling pressure.
- Chaikin Money Flow (CMF): The CMF values have been negative, suggesting a net outflow of money from the stock.
Key Observations and Opinions:
- Trend: The moving averages show a potential consolidation phase, with the MACD hinting at a possible trend reversal.
- Momentum: The RSI and Stochastic Oscillator indicate a neutral momentum, while the Williams %R suggests minor fluctuations in price.
- Volatility: The narrowing Bollinger Bands signal reduced volatility, potentially leading to a period of price stability.
- Volume: The mixed OBV and negative CMF values point towards a lack of strong buying interest and a net outflow of funds.
Conclusion:
Based on the analysis of the technical indicators, the stock is likely to experience sideways movement in the next few days. The consolidation phase indicated by the moving averages, coupled with neutral momentum and decreasing volatility, suggests a period of price stability. However, the mixed volume signals caution against expecting significant price movements. Traders may consider adopting a cautious approach and closely monitoring key support and resistance levels for potential breakout opportunities.