Technical Analysis of APCA 2024-05-10
Overview:
In analyzing the technical indicators for APCA stock over the last 5 days, we will delve into the trend, momentum, volatility, and volume indicators to provide a comprehensive outlook on the possible stock price movement in the coming days.
Trend Analysis:
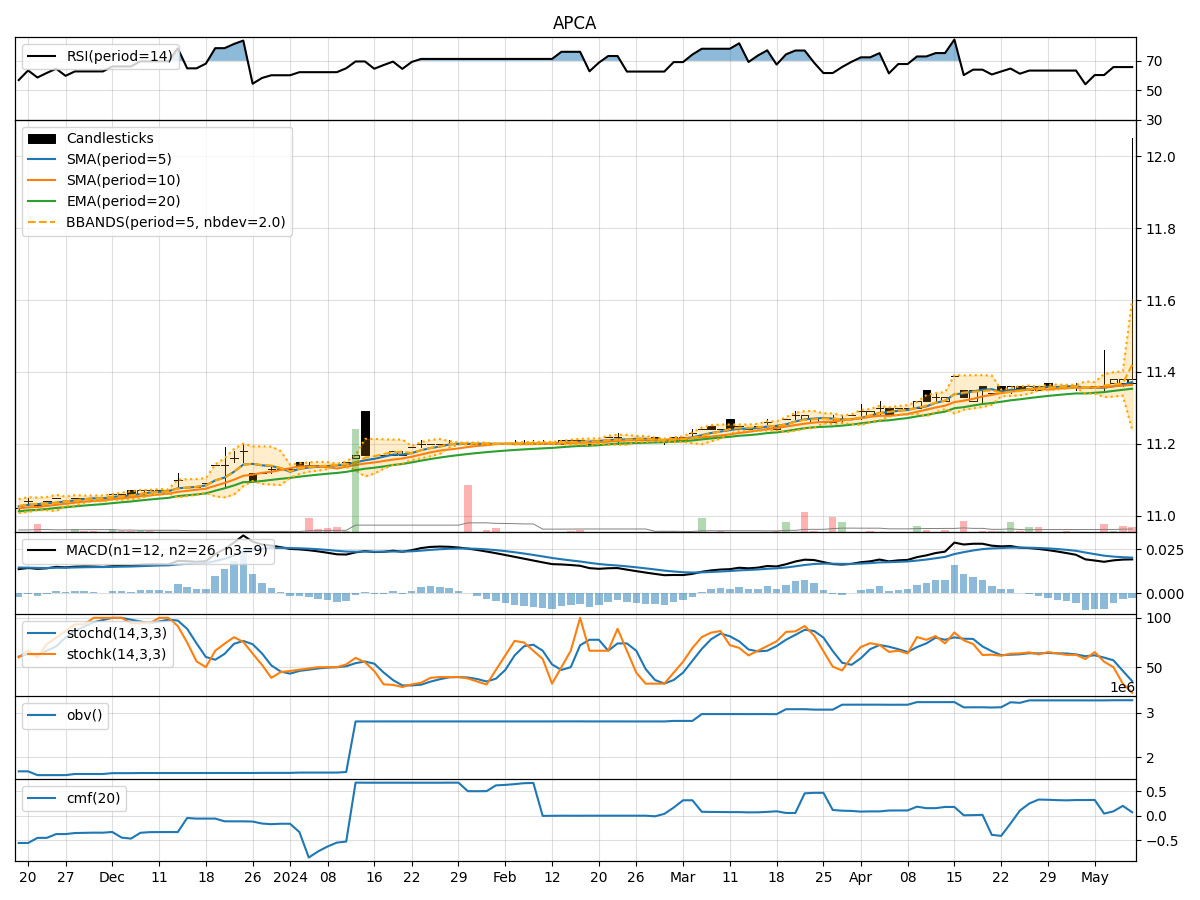
- Moving Averages (MA): The 5-day Moving Average (MA) has been relatively stable around the closing prices, indicating a consistent trend.
- MACD: The Moving Average Convergence Divergence (MACD) has shown a slight positive trend, with the MACD line consistently above the signal line.
Momentum Analysis:
- RSI: The Relative Strength Index (RSI) has been in the neutral to slightly overbought territory, suggesting a balanced momentum.
- Stochastic Oscillator: The Stochastic Oscillator indicates a downward momentum, with both %K and %D values decreasing over the last few days.
Volatility Analysis:
- Bollinger Bands (BB): The Bollinger Bands have shown a narrowing of the bands, indicating decreasing volatility in the stock price.
- Bollinger %B: The %B indicator has been fluctuating within a narrow range, suggesting a consolidation phase.
Volume Analysis:
- On-Balance Volume (OBV): The OBV has shown a slight increase, indicating a potential accumulation of the stock.
- Chaikin Money Flow (CMF): The CMF has been positive, reflecting buying pressure in the stock.
Key Observations:
- The trend indicators suggest a stable price movement with a slight positive bias.
- Momentum indicators show a mixed signal with RSI neutral and Stochastic Oscillator indicating a downward momentum.
- Volatility has been decreasing, indicating a potential consolidation phase.
- Volume indicators point towards a slight increase in buying pressure.
Conclusion:
Based on the analysis of the technical indicators, the stock price of APCA is likely to experience a period of consolidation in the coming days. The stable trend, decreasing volatility, and mixed momentum signals suggest a potential sideways movement in the stock price. Traders may consider adopting a neutral stance or implementing range-bound strategies until clearer trends emerge in the market.