Technical Analysis of AON 2024-05-10
Overview:
In analyzing the technical indicators for AON stock over the last 5 days, we will delve into the trend, momentum, volatility, and volume indicators to provide a comprehensive outlook on the possible future stock price movement. By examining these key indicators, we aim to offer valuable insights and predictions for the upcoming trading days.
Trend Analysis:
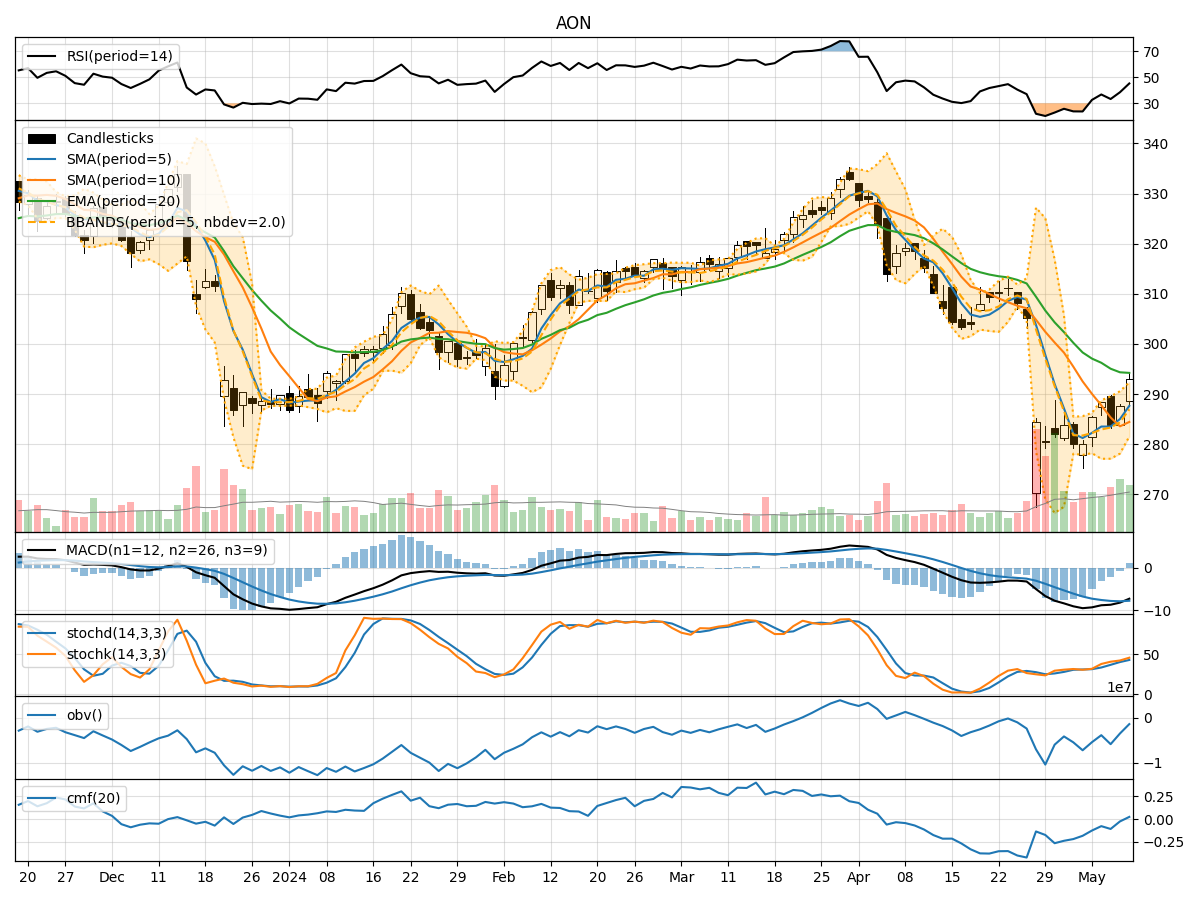
- Moving Averages (MA): The 5-day Moving Average (MA) has been fluctuating around the closing prices, indicating short-term price trends. The Simple Moving Average (SMA) and Exponential Moving Average (EMA) show a downward trend, suggesting a bearish sentiment in the market.
- MACD: The Moving Average Convergence Divergence (MACD) line has been negative, with the MACD Histogram also in the negative territory. This indicates a bearish momentum in the stock price.
Momentum Analysis:
- RSI: The Relative Strength Index (RSI) has been below 50, indicating a bearish momentum in the stock. The RSI values have been increasing but are still below the overbought threshold, suggesting a potential continuation of the bearish trend.
- Stochastic Oscillator: Both %K and %D lines of the Stochastic Oscillator have been rising but are still below the overbought threshold. This indicates a potential upward momentum but not strong enough to signal a reversal.
Volatility Analysis:
- Bollinger Bands (BB): The Bollinger Bands have been narrowing, indicating decreasing volatility in the stock price. The bands are currently close to each other, suggesting a period of consolidation or a potential breakout in the near future.
Volume Analysis:
- On-Balance Volume (OBV): The OBV has been fluctuating, indicating indecision among market participants. The Chaikin Money Flow (CMF) has been negative, reflecting selling pressure in the stock.
Key Observations:
- The trend indicators show a bearish sentiment with moving averages and MACD signaling a potential downward movement.
- Momentum indicators suggest a weak bullish momentum but not strong enough to reverse the bearish trend.
- Volatility is decreasing, indicating a period of consolidation or a potential breakout.
- Volume indicators reflect indecision among traders with selling pressure evident in the OBV and CMF.
Conclusion:
Based on the analysis of the technical indicators, the stock price of AON is likely to experience further downward movement in the next few trading days. The bearish sentiment indicated by the trend and momentum indicators, coupled with the lack of strong buying pressure in the volume indicators, suggests a continuation of the current downtrend. Traders should exercise caution and consider short-term bearish strategies until a clear reversal signal is observed in the technical indicators.