Technical Analysis of AMTD 2024-05-10
Overview:
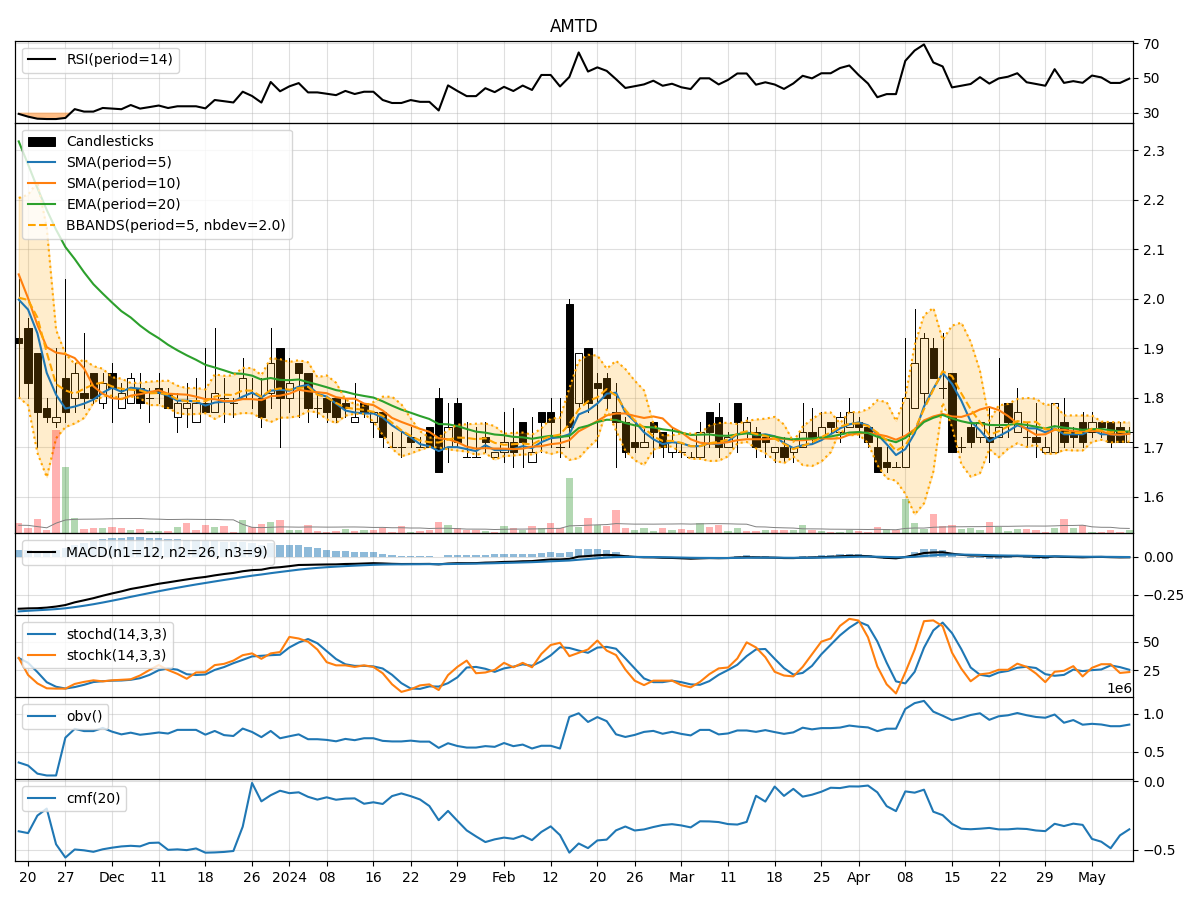
In analyzing the technical indicators for AMTD over the last 5 days, we will delve into the trend, momentum, volatility, and volume indicators to provide a comprehensive outlook on the possible stock price movement in the coming days.
Trend Analysis:
- Moving Averages (MA): The 5-day Moving Average (MA) has been fluctuating around the 1.73-1.74 range, indicating a relatively stable trend.
- MACD: The Moving Average Convergence Divergence (MACD) has been consistently negative, suggesting a bearish trend in the short term.
Momentum Analysis:
- RSI: The Relative Strength Index (RSI) has been hovering around the mid-range, indicating a neutral momentum.
- Stochastic Oscillator: Both %K and %D have shown mixed signals, with no clear indication of overbought or oversold conditions.
Volatility Analysis:
- Bollinger Bands (BB): The Bollinger Bands have shown narrowing volatility, with the bands converging, indicating a potential decrease in price volatility.
Volume Analysis:
- On-Balance Volume (OBV): The OBV has been relatively flat, suggesting a lack of significant buying or selling pressure.
- Chaikin Money Flow (CMF): The CMF has been negative, indicating a bearish money flow trend.
Key Observations:
- The trend indicators suggest a neutral to slightly bearish outlook.
- Momentum indicators show a lack of clear direction in the short term.
- Volatility is decreasing, indicating a potential period of consolidation.
- Volume indicators point to a lack of significant buying or selling pressure.
Conclusion:
Based on the analysis of the technical indicators, the stock price of AMTD is likely to consolidate in the coming days, with a neutral to slightly bearish bias. Traders may expect the price to trade within a narrow range with limited volatility. It is advisable to closely monitor key support and resistance levels for potential breakout opportunities.