Technical Analysis of AMT 2024-05-10
Overview:
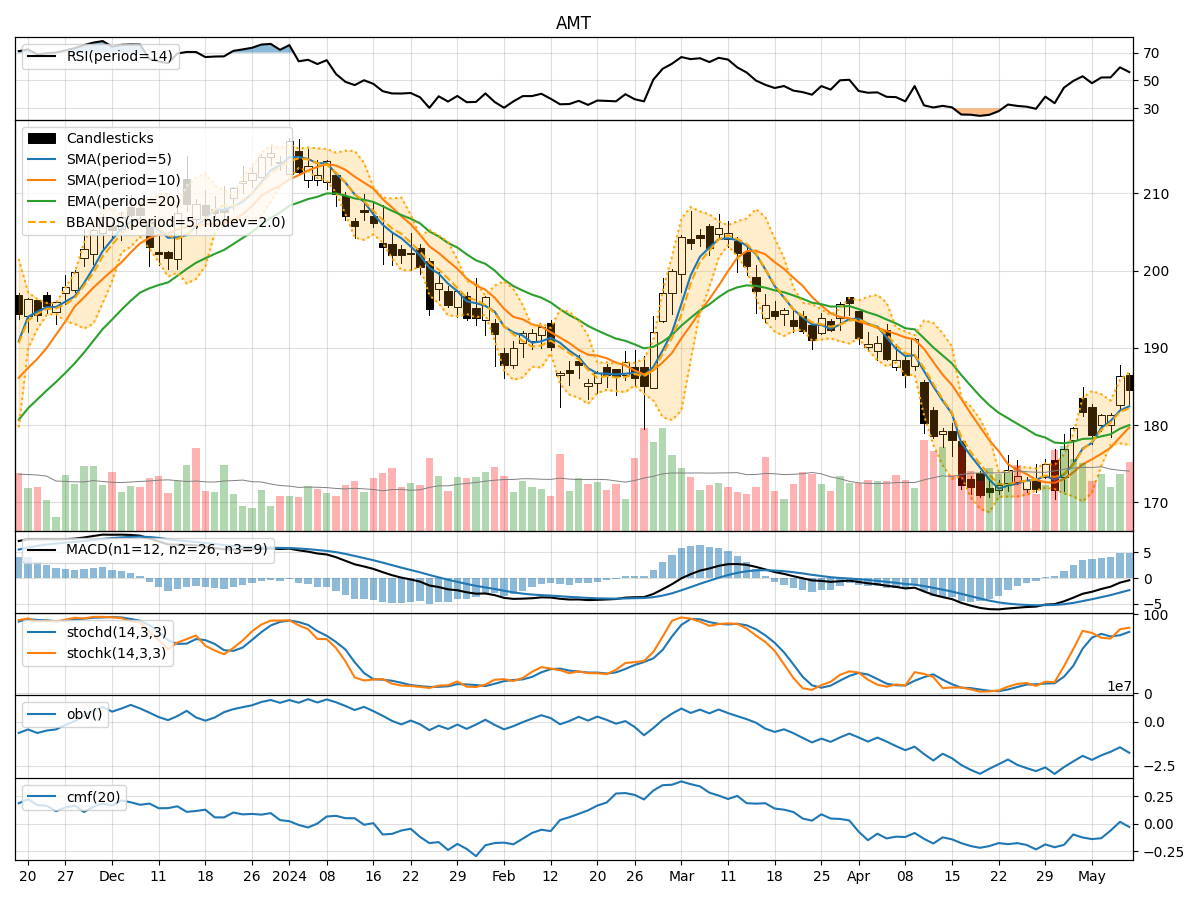
In analyzing the technical indicators for AMT over the last 5 days, we will delve into the trend, momentum, volatility, and volume indicators to provide a comprehensive outlook on the possible stock price movement in the coming days.
Trend Analysis:
- Moving Averages (MA): The 5-day Moving Average has been consistently above the Simple Moving Average (SMA) and Exponential Moving Average (EMA), indicating a bullish trend.
- MACD: The MACD line has been consistently above the signal line, suggesting a bullish momentum in the stock price.
- Conclusion: The trend indicators point towards an upward trend in the stock price.
Momentum Analysis:
- RSI: The Relative Strength Index (RSI) has been increasing, indicating strengthening momentum.
- Stochastic Oscillator: Both %K and %D have been in the overbought zone, suggesting a strong bullish momentum.
- Conclusion: Momentum indicators signal a bullish sentiment in the stock.
Volatility Analysis:
- Bollinger Bands: The stock price has been trading within the upper Bollinger Band, indicating high volatility.
- Conclusion: Volatility indicators suggest a highly volatile trading environment.
Volume Analysis:
- On-Balance Volume (OBV): The OBV has been fluctuating, indicating mixed buying and selling pressure.
- Chaikin Money Flow (CMF): The CMF has been negative, suggesting a bearish money flow.
- Conclusion: Volume indicators show a mixed sentiment in terms of buying and selling pressure.
Conclusion:
Based on the analysis of the technical indicators, the next few days' possible stock price movement for AMT is likely to be upward with high volatility. The trend and momentum indicators strongly support a bullish outlook, while the volume indicators show a mixed sentiment. Traders should be cautious of the high volatility and monitor the stock closely for potential entry or exit points.
Key Recommendations:
- Consider Going Long: Traders may consider taking long positions in AMT based on the bullish trend and momentum indicators.
- Set Stop-Loss: Due to the high volatility, it is essential to set stop-loss orders to manage risk effectively.
- Monitor Volume: Keep a close eye on the volume indicators to gauge the strength of buying and selling pressure.
- Stay Informed: Stay updated on market news and events that could impact AMT's stock price movement.
In conclusion, the technical analysis suggests a bullish outlook for AMT in the next few days, but traders should exercise caution due to the high volatility in the market.