Technical Analysis of AMP 2024-05-10
Overview:
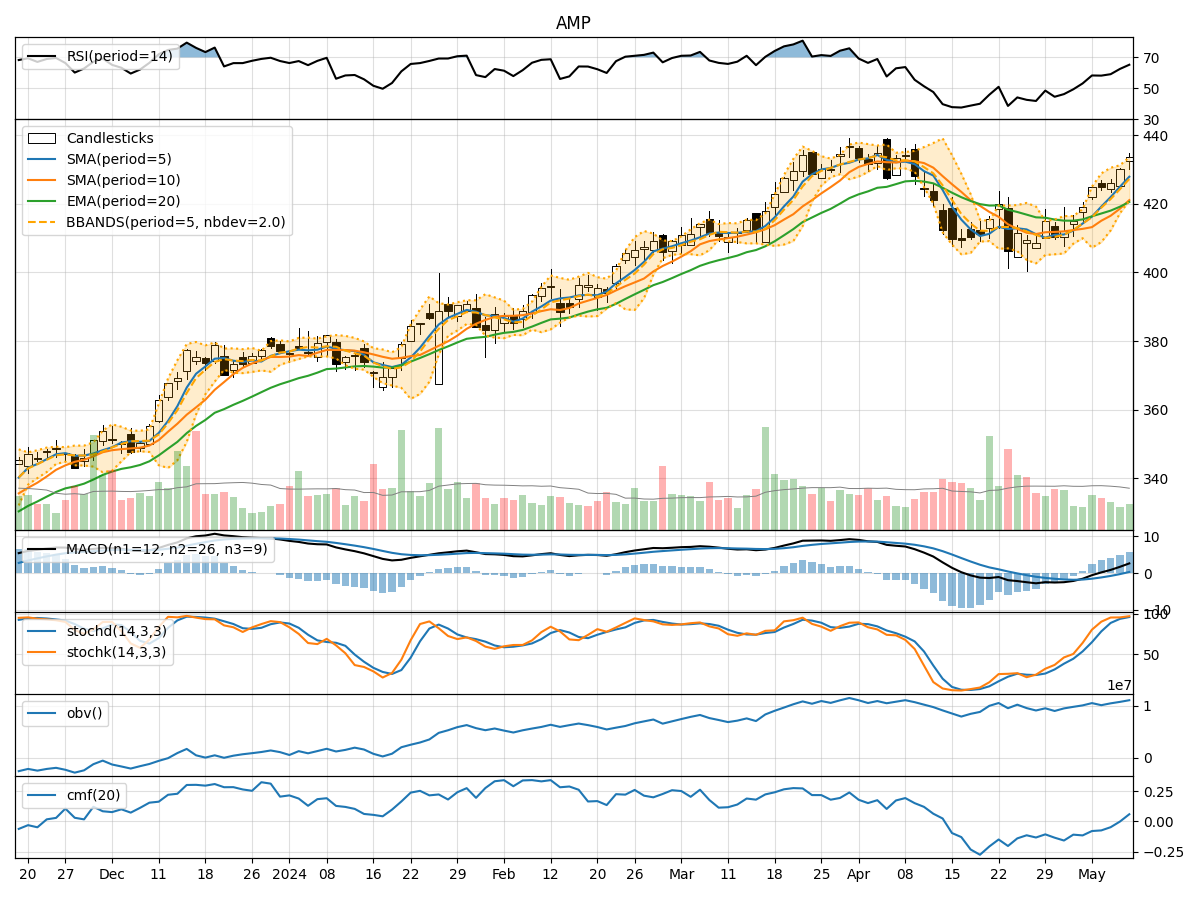
In analyzing the technical indicators for AMP over the last 5 days, we will delve into the trend, momentum, volatility, and volume indicators to provide a comprehensive outlook on the possible stock price movement in the coming days.
Trend Analysis:
- Moving Averages (MA): The 5-day Moving Average (MA) has been consistently rising, indicating an upward trend in the stock price.
- MACD: The MACD line has been consistently above the signal line, suggesting bullish momentum in the stock.
- EMA: The Exponential Moving Average (EMA) has also been trending upwards, supporting the bullish sentiment in the stock.
Momentum Analysis:
- RSI: The Relative Strength Index (RSI) has been increasing, indicating strengthening momentum in the stock.
- Stochastic Oscillator: Both %K and %D have been in overbought territory, suggesting a potential pullback in the stock price.
- Williams %R: The Williams %R is in oversold territory, indicating a possible reversal in the stock price.
Volatility Analysis:
- Bollinger Bands: The stock price has been trading near the upper Bollinger Band, indicating high volatility and a potential overbought condition.
- Bollinger Band Width: The Band Width has been narrowing, suggesting a potential decrease in volatility and a period of consolidation.
Volume Analysis:
- On-Balance Volume (OBV): The OBV has been increasing, indicating accumulation of the stock by investors.
- Chaikin Money Flow (CMF): The CMF has been negative, suggesting selling pressure in the stock.
Key Observations:
- The trend indicators suggest a strong bullish sentiment in the stock, supported by rising moving averages and MACD.
- Momentum indicators show a mix of overbought and oversold conditions, indicating a potential reversal or consolidation.
- Volatility indicators point towards high volatility near the upper Bollinger Band, potentially signaling a period of consolidation.
- Volume indicators reflect accumulation in the stock but with some selling pressure indicated by the negative CMF.
Conclusion:
Based on the analysis of the technical indicators, the stock price of AMP is likely to experience a short-term consolidation or pullback in the coming days. The bullish trend may pause as the stock is currently overbought based on the Stochastic Oscillator and near the upper Bollinger Band. Traders should exercise caution and consider taking profits or waiting for a better entry point.