Technical Analysis of AME 2024-05-10
Overview:
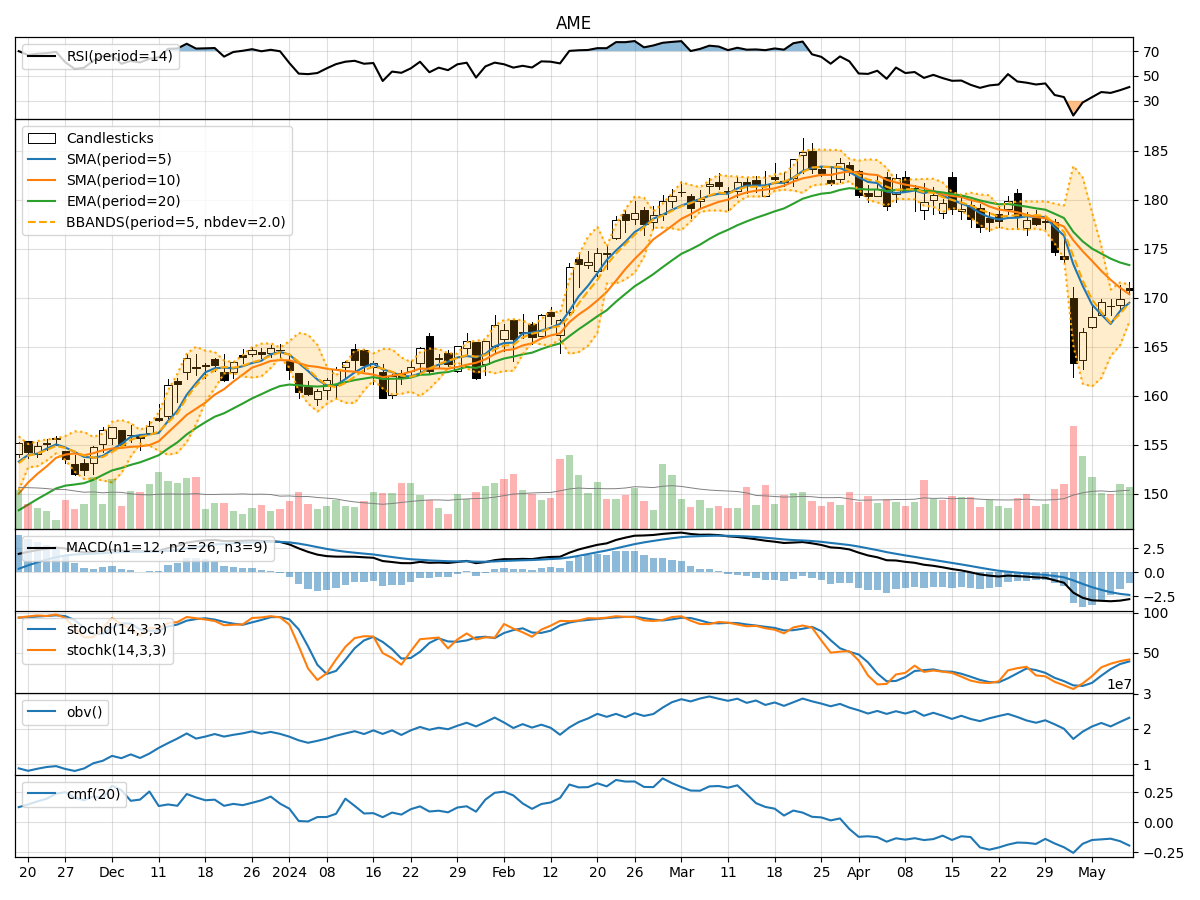
In analyzing the technical indicators for AME over the last 5 days, we will delve into the trend, momentum, volatility, and volume indicators to provide a comprehensive outlook on the possible stock price movement in the coming days. By examining these key aspects, we aim to offer valuable insights and predictions to guide your investment decisions.
Trend Analysis:
- Moving Averages (MA): The 5-day Moving Average (MA) has been consistently below the Simple Moving Average (SMA) and Exponential Moving Average (EMA) over the past 5 days, indicating a downward trend in the stock price.
- MACD: The Moving Average Convergence Divergence (MACD) has been negative, with the MACD line consistently below the signal line, suggesting bearish momentum in the stock.
Momentum Analysis:
- RSI: The Relative Strength Index (RSI) has been gradually increasing but remains below the overbought threshold of 70, indicating a potential for further upside momentum.
- Stochastic Oscillator: Both %K and %D lines of the Stochastic Oscillator have been rising, signaling increasing buying pressure in the stock.
Volatility Analysis:
- Bollinger Bands: The Bollinger Bands have been narrowing, indicating decreasing volatility in the stock price.
- Bollinger %B: The %B indicator has been trending upwards, suggesting a potential for a bullish breakout in the near term.
Volume Analysis:
- On-Balance Volume (OBV): The OBV has shown mixed signals, fluctuating over the past 5 days without a clear trend.
- Chaikin Money Flow (CMF): The CMF has been negative, indicating selling pressure in the stock.
Conclusion:
Based on the analysis of the technical indicators, the stock of AME is currently exhibiting a mixed outlook: - Trend: The stock is in a downtrend based on moving averages and MACD. - Momentum: There is a potential for upside momentum as indicated by the RSI and Stochastic Oscillator. - Volatility: Volatility is decreasing, suggesting a possible period of consolidation. - Volume: The volume indicators are inconclusive, with mixed signals from OBV and CMF.
Overall Assessment:
Considering the mixed signals from the technical indicators, it is recommended to exercise caution in trading AME in the next few days. While there is a potential for upside momentum, the overall trend remains bearish, and the lack of clear direction in volume indicators adds to the uncertainty. Traders may consider waiting for more definitive signals or implementing risk management strategies to navigate the current market dynamics effectively.