Technical Analysis of ALLE 2024-05-10
Overview:
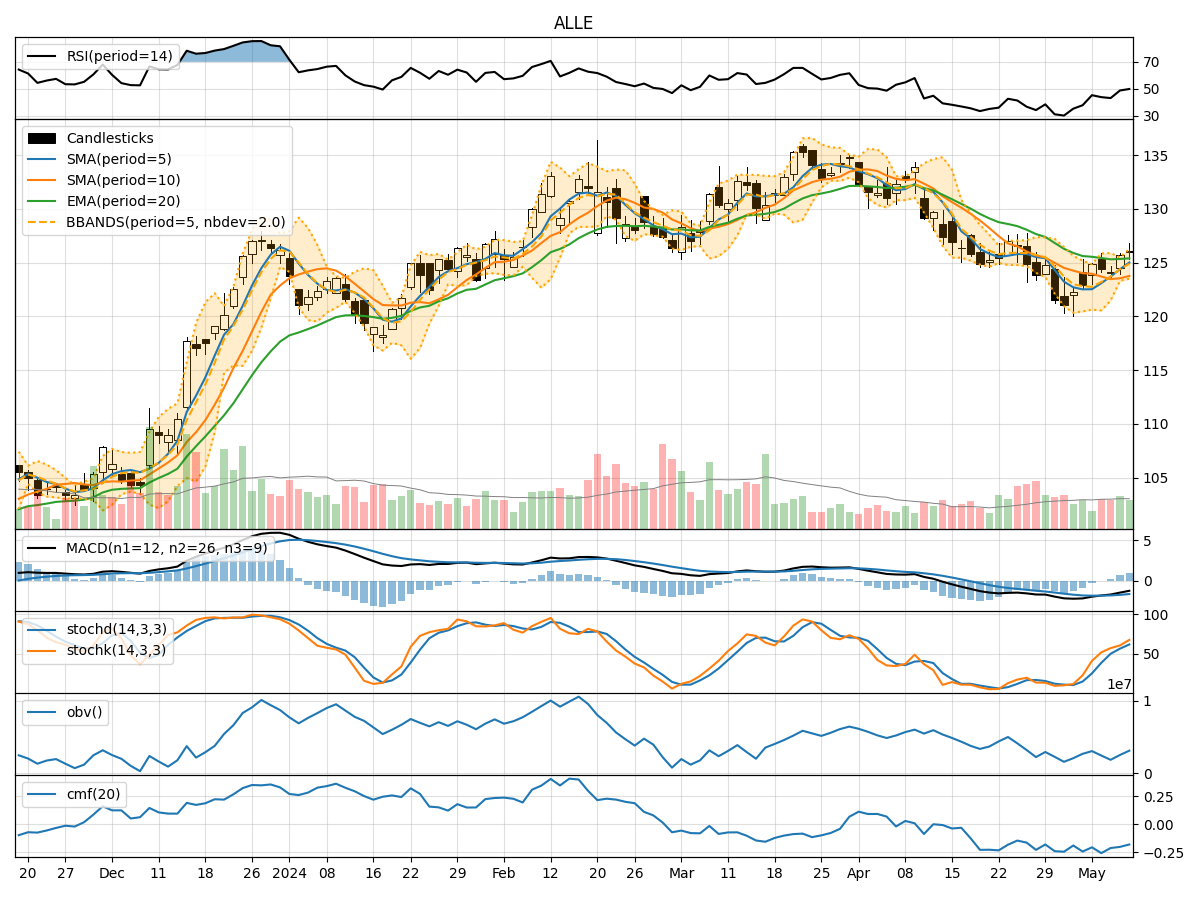
In analyzing the technical indicators for ALLE over the last 5 days, we will delve into the trend, momentum, volatility, and volume indicators to provide a comprehensive outlook on the possible stock price movement in the coming days. By examining these key indicators, we aim to offer valuable insights and predictions for informed decision-making.
Trend Analysis:
- Moving Averages (MA): The 5-day Moving Average (MA) has been consistently rising, indicating a bullish trend in the short term.
- MACD: The Moving Average Convergence Divergence (MACD) has shown positive values, suggesting a bullish momentum.
- EMA: The Exponential Moving Average (EMA) has been above the closing prices, indicating a positive trend.
Key Observation: The trend indicators point towards an upward trend in the stock price.
Momentum Analysis:
- RSI: The Relative Strength Index (RSI) has been increasing, indicating strengthening momentum.
- Stochastic Oscillator: Both %K and %D have been rising, suggesting increasing buying pressure.
- Williams %R: The indicator has been moving towards the oversold region, indicating a potential reversal.
Key Observation: Momentum indicators suggest a bullish sentiment in the market.
Volatility Analysis:
- Bollinger Bands (BB): The bands have been narrowing, indicating decreasing volatility.
- Bollinger %B: The %B indicator has been hovering around 0.8, suggesting a potential consolidation phase.
Key Observation: Volatility indicators signal a consolidation phase in the stock price.
Volume Analysis:
- On-Balance Volume (OBV): The OBV has been declining, indicating selling pressure.
- Chaikin Money Flow (CMF): The CMF has been negative, suggesting outflow of money from the stock.
Key Observation: Volume indicators reflect a bearish sentiment in the market.
Conclusion:
Based on the analysis of the technical indicators, the next few days' possible stock price movement for ALLE is likely to be upward in line with the bullish trend and momentum indicators. However, the narrowing Bollinger Bands and negative volume indicators suggest a potential consolidation phase before a further upward movement. Traders should closely monitor the price action for confirmation of the anticipated trend.
Disclaimer:
This analysis is based solely on technical indicators and historical data, and actual market movements may vary. It is essential to consider other fundamental factors and risk management strategies before making any investment decisions.