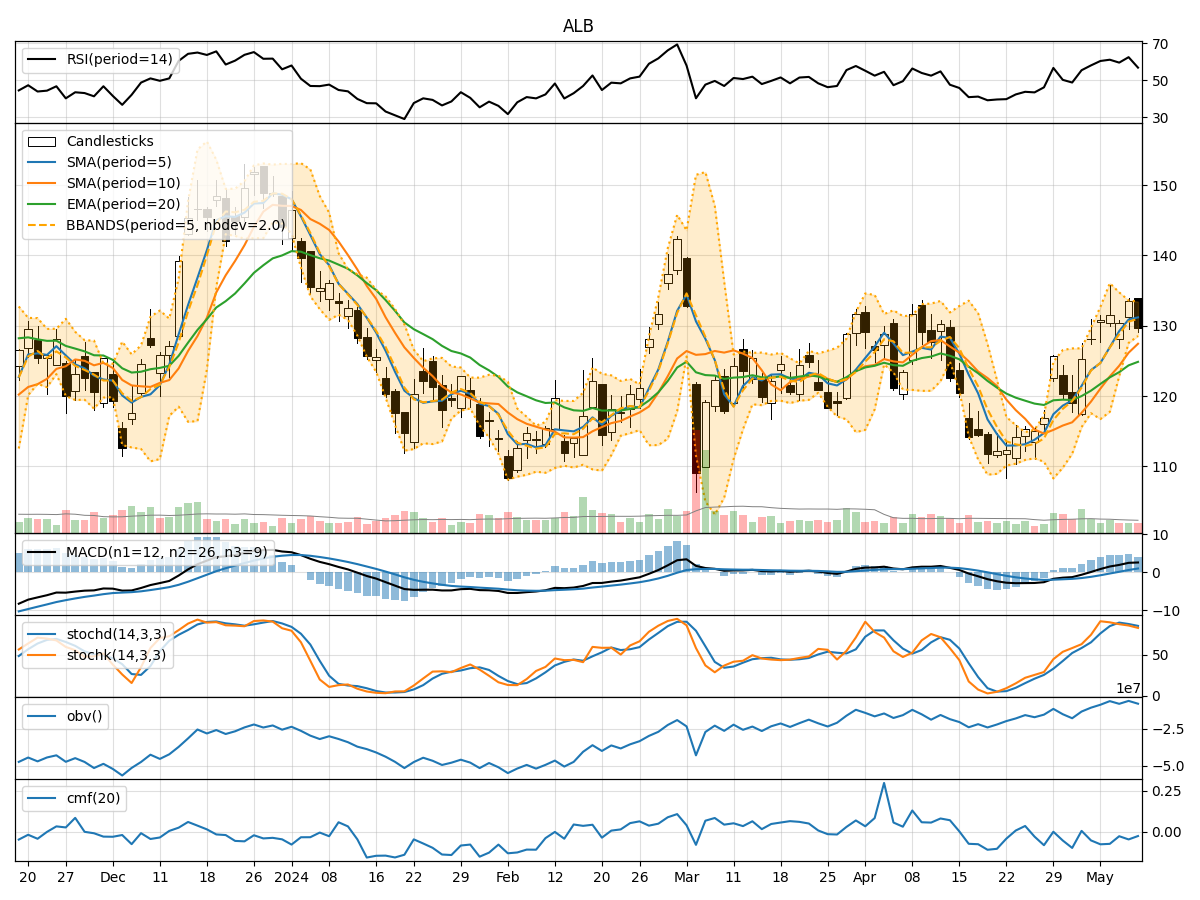
Technical Analysis of ALB 2024-05-10
Overview:
In analyzing the technical indicators for ALB over the last 5 days, we will delve into the trend, momentum, volatility, and volume indicators to provide a comprehensive outlook on the possible stock price movement in the coming days.
Trend Indicators:
- Moving Averages (MA): The 5-day MA has been consistently above the longer-term SMAs and EMAs, indicating a bullish trend.
- MACD: The MACD line has been above the signal line, suggesting positive momentum.
- MACD Histogram: The histogram has been increasing, indicating strengthening bullish momentum.
Momentum Indicators:
- RSI: The RSI has been fluctuating around the neutral 50 level, indicating indecision in the market.
- Stochastic Oscillator: Both %K and %D have been declining, signaling a potential bearish momentum.
- Williams %R: The indicator has been in oversold territory, suggesting a possible reversal.
Volatility Indicators:
- Bollinger Bands: The stock price has been trading within the bands, indicating normal volatility.
- Bollinger %B: The %B indicator has been fluctuating around the middle range, suggesting no extreme conditions.
Volume Indicators:
- On-Balance Volume (OBV): The OBV has been relatively stable, indicating no significant divergence between price and volume.
- Chaikin Money Flow (CMF): The CMF has been negative, suggesting selling pressure in the market.
Key Observations:
- The trend indicators point towards a bullish sentiment with moving averages and MACD supporting an upward trend.
- Momentum indicators show mixed signals with RSI neutral, stochastic oscillator turning bearish, and Williams %R in oversold territory.
- Volatility indicators suggest normal price fluctuations within the Bollinger Bands.
- Volume indicators indicate stable volume with a slight selling pressure based on CMF.
Conclusion:
Based on the analysis of the technical indicators, the stock price of ALB is likely to experience further consolidation in the coming days. The bullish trend indicated by moving averages and MACD may face resistance due to the mixed momentum signals and selling pressure reflected in the volume indicators. Traders should exercise caution and monitor key levels for potential reversals.