Technical Analysis of AGRO 2024-05-10
Overview:
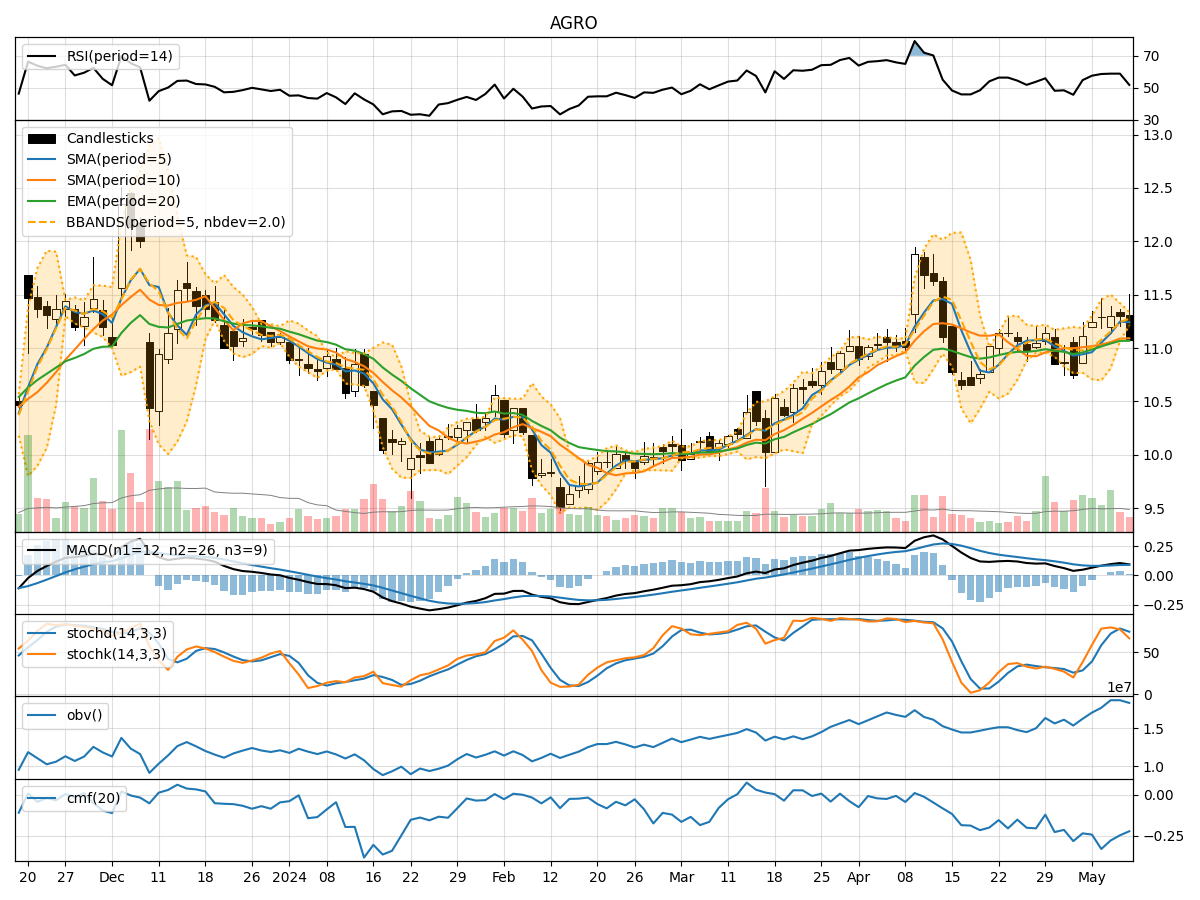
In analyzing the technical indicators for AGRO over the last 5 days, we will delve into the trend, momentum, volatility, and volume indicators to provide a comprehensive outlook on the possible stock price movement in the coming days. By examining key metrics such as moving averages, MACD, RSI, Bollinger Bands, and OBV, we aim to offer valuable insights and predictions for potential investors.
Trend Indicators:
- Moving Averages (MA): The 5-day MA has been consistently above the closing prices, indicating a short-term uptrend.
- MACD: The MACD line has been positive, with the MACD histogram showing an increasing trend, suggesting bullish momentum.
- EMA: The EMA has been trending upwards, supporting the bullish sentiment.
Momentum Indicators:
- RSI: The RSI has been hovering around 60, indicating a neutral to slightly bullish momentum.
- Stochastic Oscillator: Both %K and %D have been in the overbought territory, signaling a potential reversal.
- Williams %R: The indicator has been in the oversold region, suggesting a possible buying opportunity.
Volatility Indicators:
- Bollinger Bands: The stock price has been trading within the bands, indicating a period of consolidation.
- Bollinger %B: The %B value is close to 0.5, suggesting a balanced market sentiment.
Volume Indicators:
- On-Balance Volume (OBV): The OBV has been relatively stable, indicating a neutral volume flow.
- Chaikin Money Flow (CMF): The CMF has been negative, reflecting selling pressure in the market.
Key Observations:
- The trend indicators point towards a bullish sentiment, supported by the positive MACD and EMA trends.
- Momentum indicators show a mixed signal, with RSI neutral, Stochastic overbought, and Williams %R oversold.
- Volatility indicators suggest a period of consolidation, as the stock price moves within the Bollinger Bands.
- Volume indicators indicate a lack of strong buying or selling pressure, with OBV and CMF showing neutrality.
Conclusion:
Based on the analysis of the technical indicators, the next few days for AGRO could see sideways movement with a slight bullish bias. Traders may observe the stock price consolidating within a range, potentially testing both support and resistance levels. It is advisable to closely monitor the Stochastic oscillator for a potential reversal signal and the OBV for any significant shifts in volume sentiment. Overall, a cautious approach with a focus on risk management would be prudent in the current market environment.