Technical Analysis of ABT 2024-05-10
Overview:
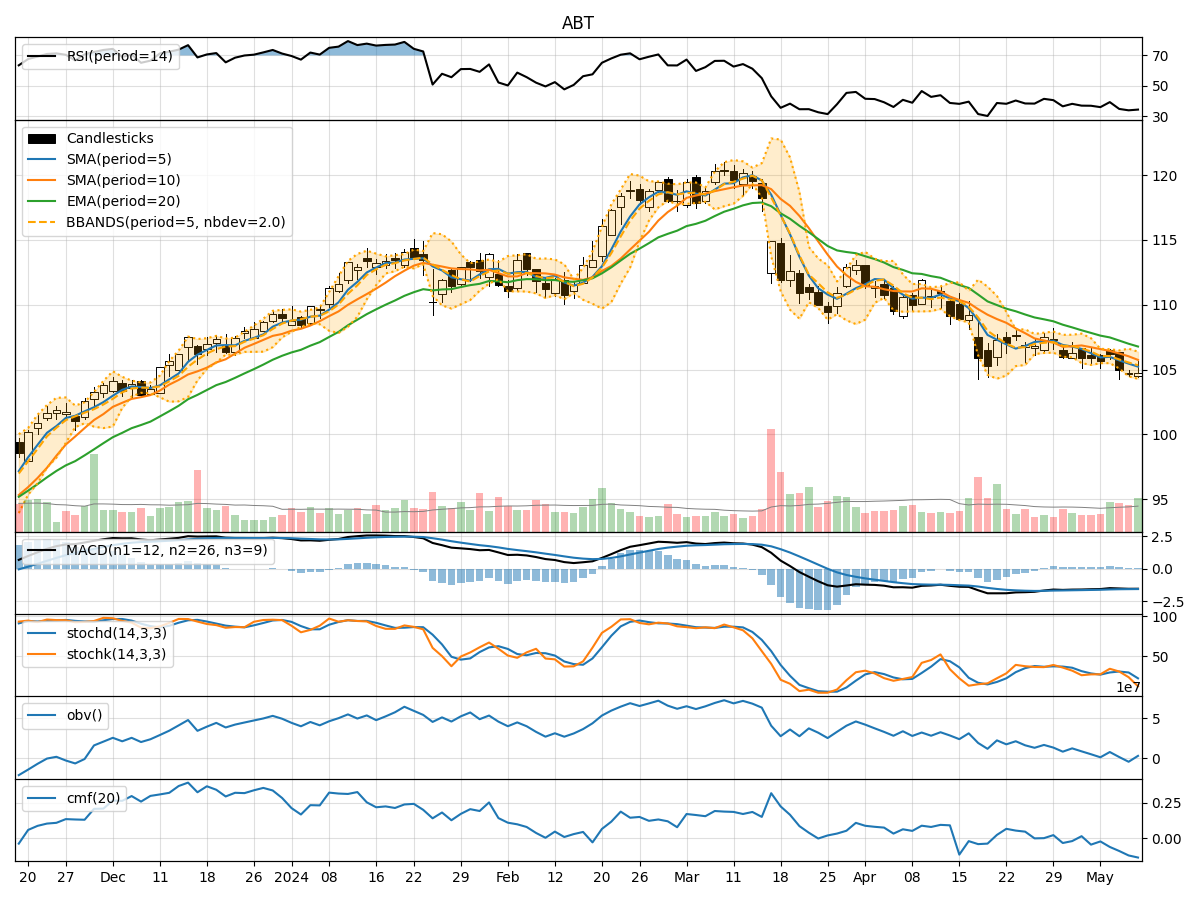
In analyzing the technical indicators for ABT over the last 5 days, we will delve into the trend, momentum, volatility, and volume indicators to provide a comprehensive outlook on the possible stock price movement in the coming days.
Trend Indicators:
- Moving Averages (MA): The 5-day MA has been consistently below the closing price, indicating a short-term downtrend.
- MACD: The MACD line has been hovering around the signal line, suggesting a lack of strong momentum in either direction.
- EMA: The 20-day EMA is above the current price, indicating a longer-term bearish trend.
Key Observation: The trend indicators point towards a bearish sentiment in both the short and long term.
Momentum Indicators:
- RSI: The RSI has been below 50, indicating a bearish momentum.
- Stochastic Oscillator: Both %K and %D have been trending downwards, signaling a bearish momentum.
- Williams %R: The indicator has been consistently in the oversold territory, suggesting a bearish sentiment.
Key Observation: Momentum indicators align with the trend indicators, indicating a strong bearish momentum in the stock.
Volatility Indicators:
- Bollinger Bands: The bands have been narrowing, indicating decreasing volatility.
- Bollinger %B: The %B has been decreasing, suggesting a lack of volatility in the stock.
Key Observation: Volatility indicators show a decrease in volatility, potentially leading to a period of consolidation or a breakout in the near future.
Volume Indicators:
- On-Balance Volume (OBV): The OBV has been consistently negative, indicating selling pressure.
- Chaikin Money Flow (CMF): The CMF has been negative, reflecting a bearish sentiment.
Key Observation: Volume indicators support the bearish outlook, showing a consistent increase in selling pressure.
Conclusion:
Based on the analysis of the technical indicators, the next few days' possible stock price movement for ABT is likely to continue downwards. The bearish trend and momentum, coupled with decreasing volatility and strong selling pressure, suggest that the stock is poised for further decline. Traders and investors should exercise caution and consider shorting or staying away from long positions until a clear reversal pattern emerges.
It is crucial to monitor the indicators closely for any signs of a trend reversal, such as a bullish divergence in momentum indicators or a breakout in volatility. However, the current technical outlook strongly favors a bearish stance on ABT in the coming days.