Technical Analysis of ABR 2024-05-31
Overview:
In analyzing the technical indicators for ABR over the last 5 days, we will delve into the trend, momentum, volatility, and volume indicators to provide a comprehensive outlook on the possible stock price movement in the coming days.
Trend Analysis:
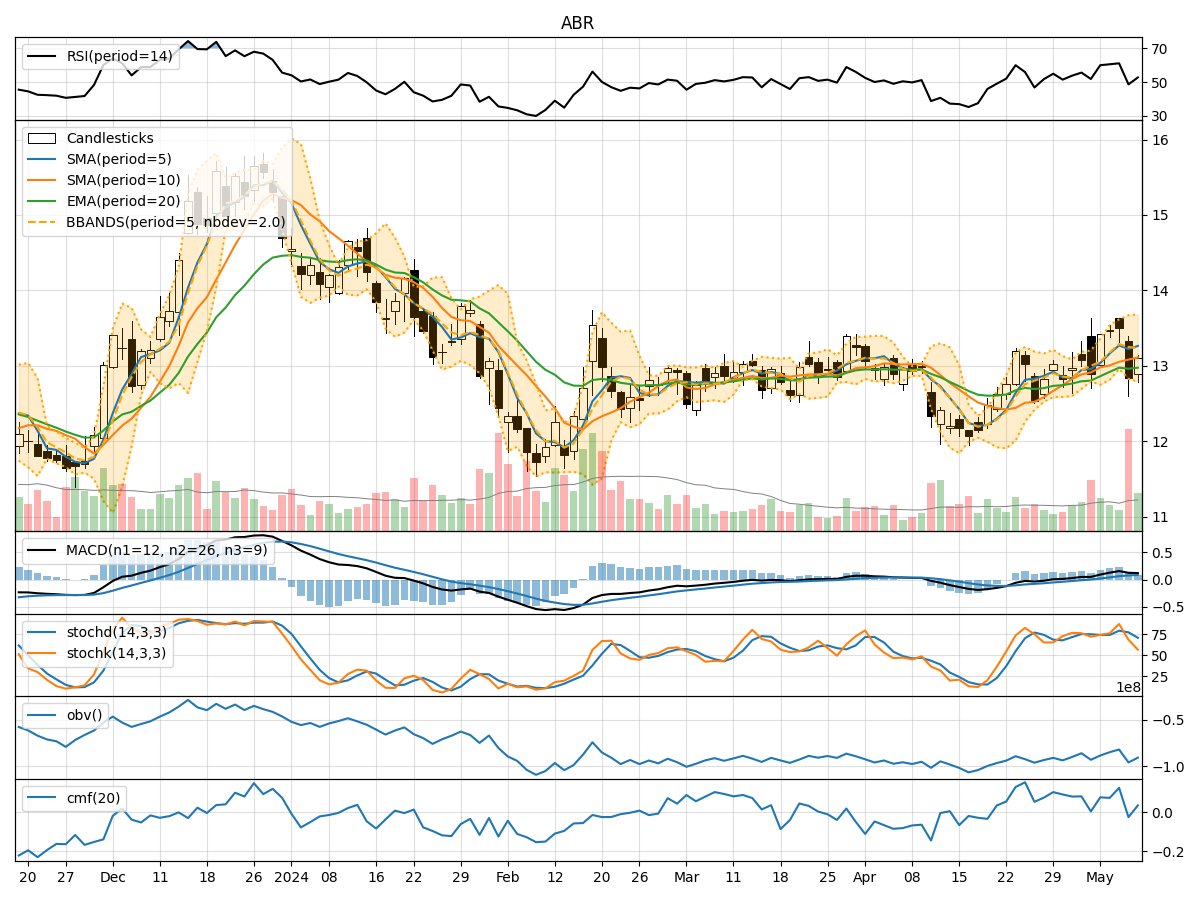
- Moving Averages (MA): The 5-day MA has been fluctuating around the closing prices, indicating short-term price trends. The SMA(10) and EMA(20) show a slight downward trend, suggesting a potential bearish sentiment.
- MACD: The MACD line has been positive but decreasing, while the MACD Histogram has been negative, indicating a weakening bullish momentum.
Momentum Analysis:
- RSI: The RSI has been hovering around the mid-level, indicating a neutral sentiment without any extreme overbought or oversold conditions.
- Stochastic Oscillator: Both %K and %D have been in the oversold region, suggesting a potential reversal or consolidation phase.
- Williams %R: The indicator has been in the oversold territory, signaling a possible buying opportunity.
Volatility Analysis:
- Bollinger Bands (BB): The bands have been narrowing, indicating decreasing volatility and a potential price breakout in the near future.
- Bollinger %B: The %B has been fluctuating around 0.5, suggesting a balanced market sentiment without any extreme conditions.
Volume Analysis:
- On-Balance Volume (OBV): The OBV has been fluctuating, indicating indecision among market participants regarding the stock.
- Chaikin Money Flow (CMF): The CMF has been negative, indicating selling pressure in the market.
Key Observations:
- The trend indicators suggest a bearish sentiment with a weakening bullish momentum.
- Momentum indicators show a neutral to slightly oversold condition, indicating a potential reversal or consolidation.
- Volatility indicators point towards decreasing volatility and a possible price breakout.
- Volume indicators reflect indecision among market participants with a slight selling pressure.
Conclusion:
Based on the analysis of the technical indicators, the stock price of ABR is likely to experience further downward movement in the coming days. The bearish trend, weakening momentum, and selling pressure indicated by the volume indicators suggest a potential continuation of the current downtrend. Traders and investors should exercise caution and consider short-term selling strategies or wait for a clear reversal signal before considering long positions.