Technical Analysis of ZAPP 2024-05-10
Overview:
In analyzing the technical indicators for ZAPP stock over the last 5 days, we will delve into the trend, momentum, volatility, and volume indicators to provide a comprehensive outlook on the possible future stock price movement. By examining these key indicators, we aim to offer valuable insights and predictions for the upcoming trading days.
Trend Analysis:
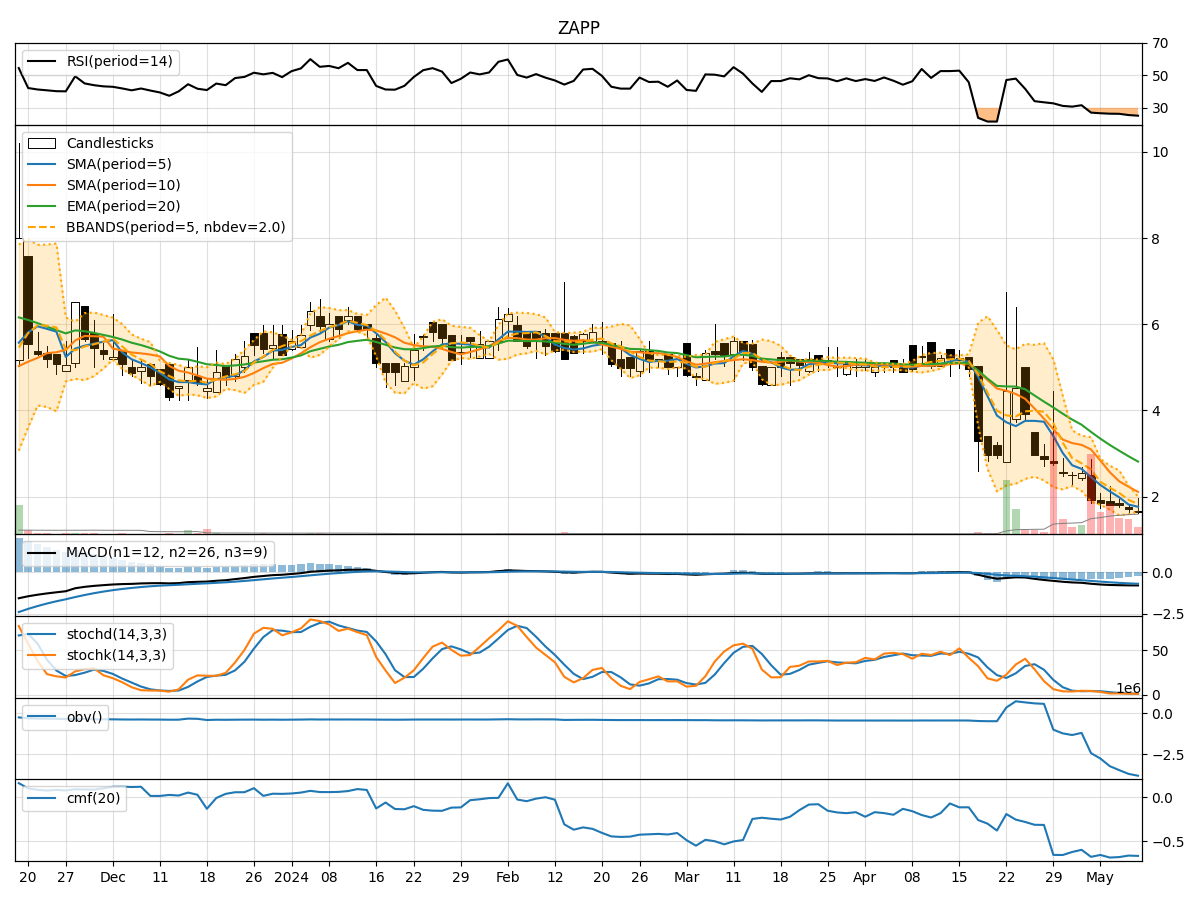
- Moving Averages (MA): The moving averages have been consistently declining over the past 5 days, indicating a downward trend in the stock price.
- MACD (Moving Average Convergence Divergence): The MACD line has been decreasing, and the MACD histogram is also showing a downward trend, suggesting bearish momentum in the stock.
Momentum Analysis:
- RSI (Relative Strength Index): The RSI values have been decreasing, indicating weakening momentum in the stock.
- Stochastic Oscillator: Both %K and %D values are low, signifying oversold conditions in the stock.
- Williams %R (Willams Percentage Range): The Williams %R values are extremely low, indicating that the stock is in oversold territory.
Volatility Analysis:
- Bollinger Bands: The Bollinger Bands are narrowing, suggesting decreasing volatility in the stock price movement.
- Bollinger %B: The %B values are low, indicating that the stock price is closer to the lower band, potentially signaling a possible reversal.
Volume Analysis:
- On-Balance Volume (OBV): The OBV values have been consistently negative, indicating selling pressure in the stock.
- Chaikin Money Flow (CMF): The CMF values are negative, suggesting that money is flowing out of the stock.
Key Observations:
- The stock is currently in a downtrend based on moving averages and MACD indicators.
- Momentum indicators such as RSI and Stochastic Oscillator suggest that the stock is oversold.
- Volatility is decreasing, as indicated by the narrowing Bollinger Bands.
- Volume indicators show a consistent selling pressure with negative OBV and CMF values.
Conclusion:
Based on the analysis of the technical indicators, the next few days' possible stock price movement for ZAPP is likely to be downward. The stock is currently in a bearish phase, with oversold conditions and selling pressure evident in the indicators. Traders and investors should exercise caution and consider waiting for signs of a potential reversal before considering any long positions.