Technical Analysis of YTRA 2024-05-10
Overview:
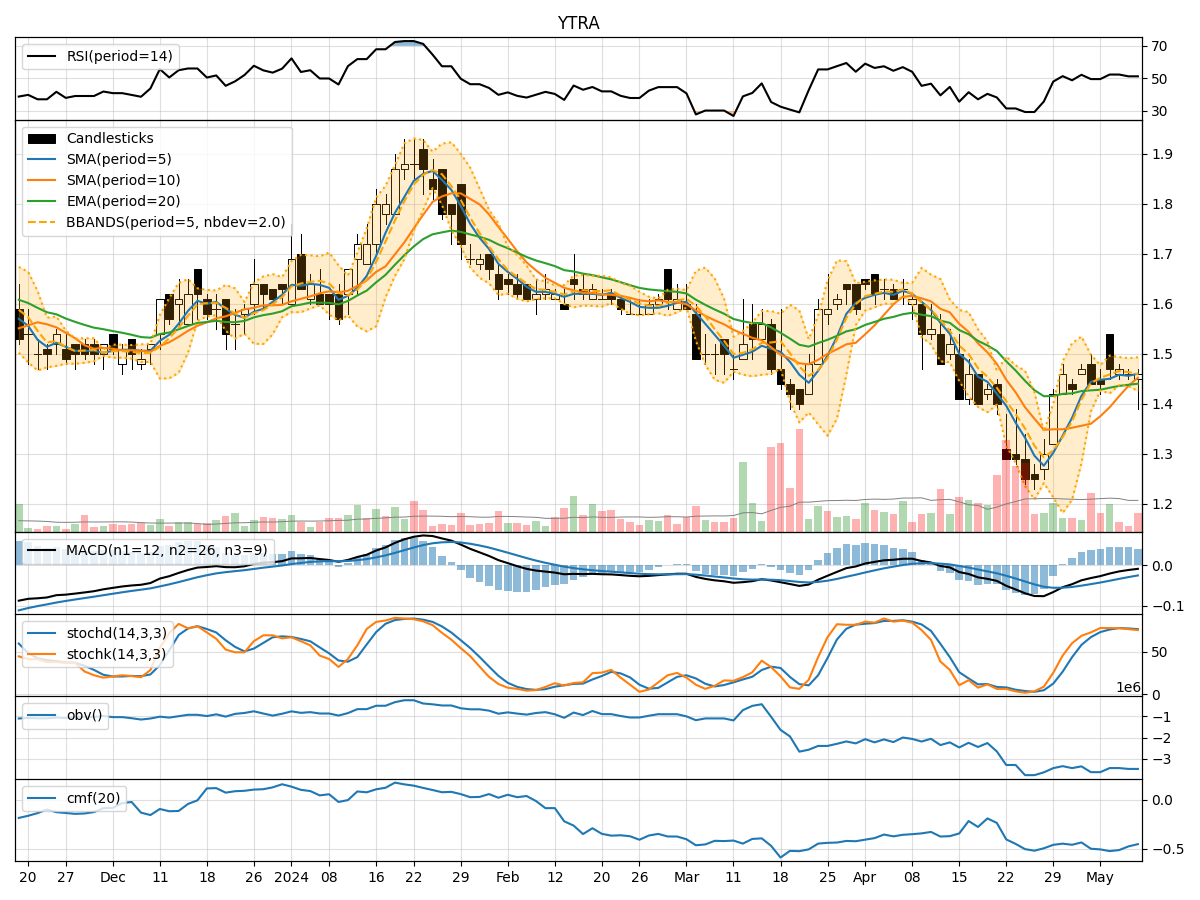
In analyzing the technical indicators for YTRA over the last 5 days, we will delve into the trend, momentum, volatility, and volume indicators to provide a comprehensive outlook on the possible stock price movement in the coming days.
Trend Analysis:
- Moving Averages (MA): The 5-day Moving Average (MA) has been showing a slight uptrend, with the stock price consistently above the MA. This indicates a positive short-term trend.
- MACD: The Moving Average Convergence Divergence (MACD) has been decreasing but remains above the signal line, suggesting a weakening bullish momentum.
Momentum Analysis:
- RSI: The Relative Strength Index (RSI) has been hovering around the neutral zone, indicating a lack of strong buying or selling pressure.
- Stochastic Oscillator: Both %K and %D have been declining, signaling a potential shift towards oversold conditions.
Volatility Analysis:
- Bollinger Bands (BB): The Bollinger Bands have been narrowing, indicating decreasing volatility and a potential upcoming breakout.
Volume Analysis:
- On-Balance Volume (OBV): The OBV has been relatively flat, suggesting a balance between buying and selling pressure.
- Chaikin Money Flow (CMF): The CMF has been negative, indicating a lack of strong buying interest.
Key Observations:
- The trend is slightly bullish in the short term, but the weakening MACD suggests a potential reversal.
- Momentum indicators show a lack of strong buying pressure and a shift towards oversold conditions.
- Volatility is decreasing, hinting at a possible consolidation phase.
- Volume indicators reflect a balanced market sentiment with a negative CMF.
Conclusion:
Based on the analysis of the technical indicators, the stock price of YTRA is likely to experience sideways movement or consolidation in the next few days. The weakening momentum and lack of strong buying pressure suggest a potential downward correction, while the narrowing Bollinger Bands indicate an upcoming breakout. Traders should exercise caution and closely monitor key support and resistance levels for potential trading opportunities.