Technical Analysis of YIBO 2024-05-10
Overview:
In analyzing the technical indicators for YIBO stock over the last 5 days, we will delve into the trends, momentum, volatility, and volume indicators to provide a comprehensive outlook on the possible future stock price movement. By examining these key aspects, we aim to offer valuable insights and recommendations for potential investors.
Trend Analysis:
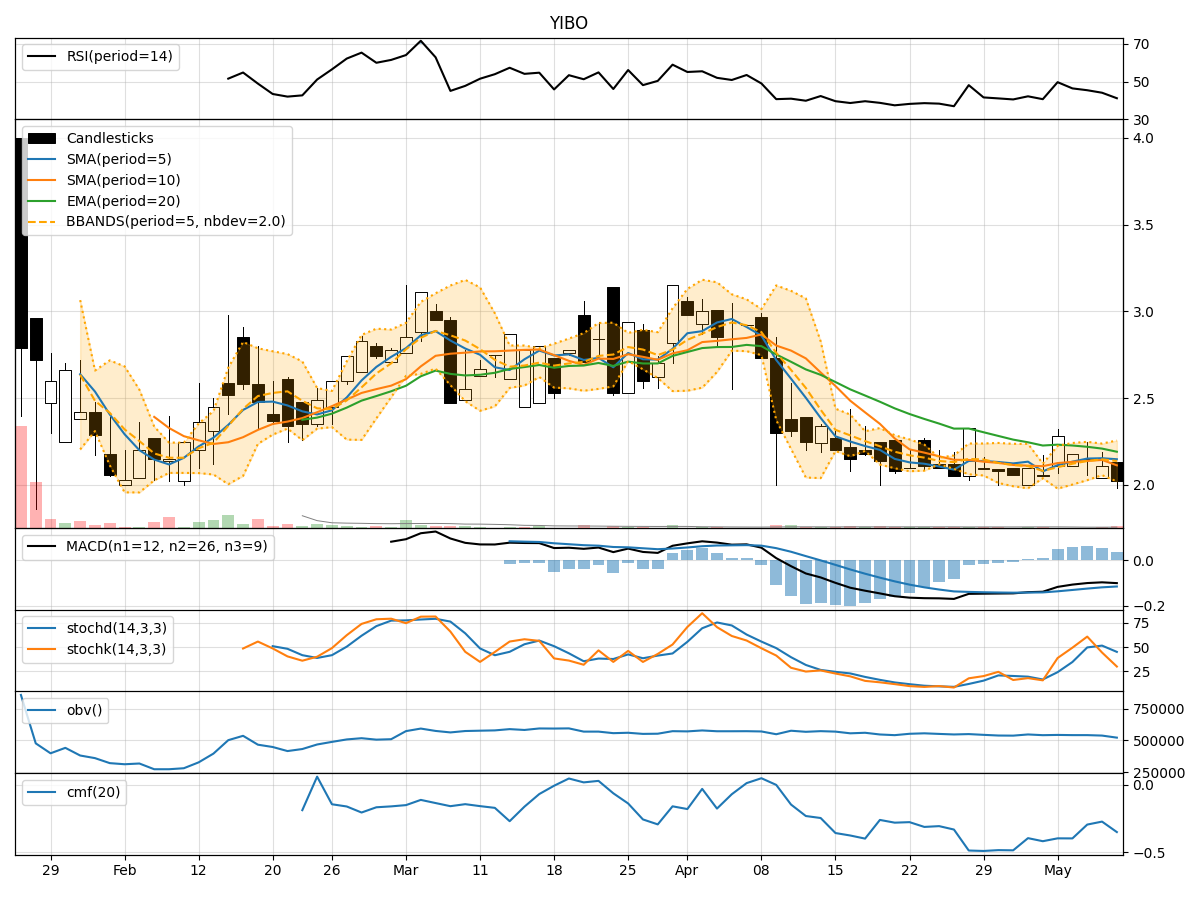
- Moving Averages (MA): The 5-day MA has been declining, indicating a short-term bearish trend.
- MACD: The MACD line has been consistently below the signal line, suggesting a bearish momentum.
- EMA: The EMA has been decreasing, aligning with the bearish sentiment in the short term.
Momentum Analysis:
- RSI: The RSI has been declining, indicating weakening momentum.
- Stochastic Oscillator: Both %K and %D have been trending downwards, signaling a bearish momentum.
- Williams %R: The indicator has been in oversold territory, suggesting a potential reversal.
Volatility Analysis:
- Bollinger Bands (BB): The bands have been narrowing, indicating decreasing volatility.
- BB %B: The %B has been decreasing, reflecting a potential consolidation phase.
Volume Analysis:
- On-Balance Volume (OBV): The OBV has been declining, indicating selling pressure.
- Chaikin Money Flow (CMF): The CMF has been negative, suggesting outflow of money from the stock.
Key Observations and Opinions:
- Trend: The stock is currently in a short-term bearish trend based on moving averages and MACD.
- Momentum: Momentum indicators suggest a bearish sentiment with potential for a reversal due to oversold conditions.
- Volatility: Volatility has been decreasing, possibly leading to a consolidation phase.
- Volume: Selling pressure is evident based on declining OBV and negative CMF.
Conclusion:
Based on the analysis of the technical indicators, the next few days for YIBO stock are likely to see further downward movement in the stock price. The bearish trend, negative momentum, decreasing volatility, and selling pressure indicated by volume indicators all point towards a bearish outlook. Investors should exercise caution and consider waiting for a more favorable entry point before considering any long positions.