Technical Analysis of YI 2024-05-10
Overview:
In analyzing the technical indicators for YI stock over the last 5 days, we will delve into the trend, momentum, volatility, and volume indicators to provide a comprehensive outlook on the possible stock price movement in the coming days. By examining these key indicators, we aim to offer valuable insights and predictions for informed decision-making.
Trend Analysis:
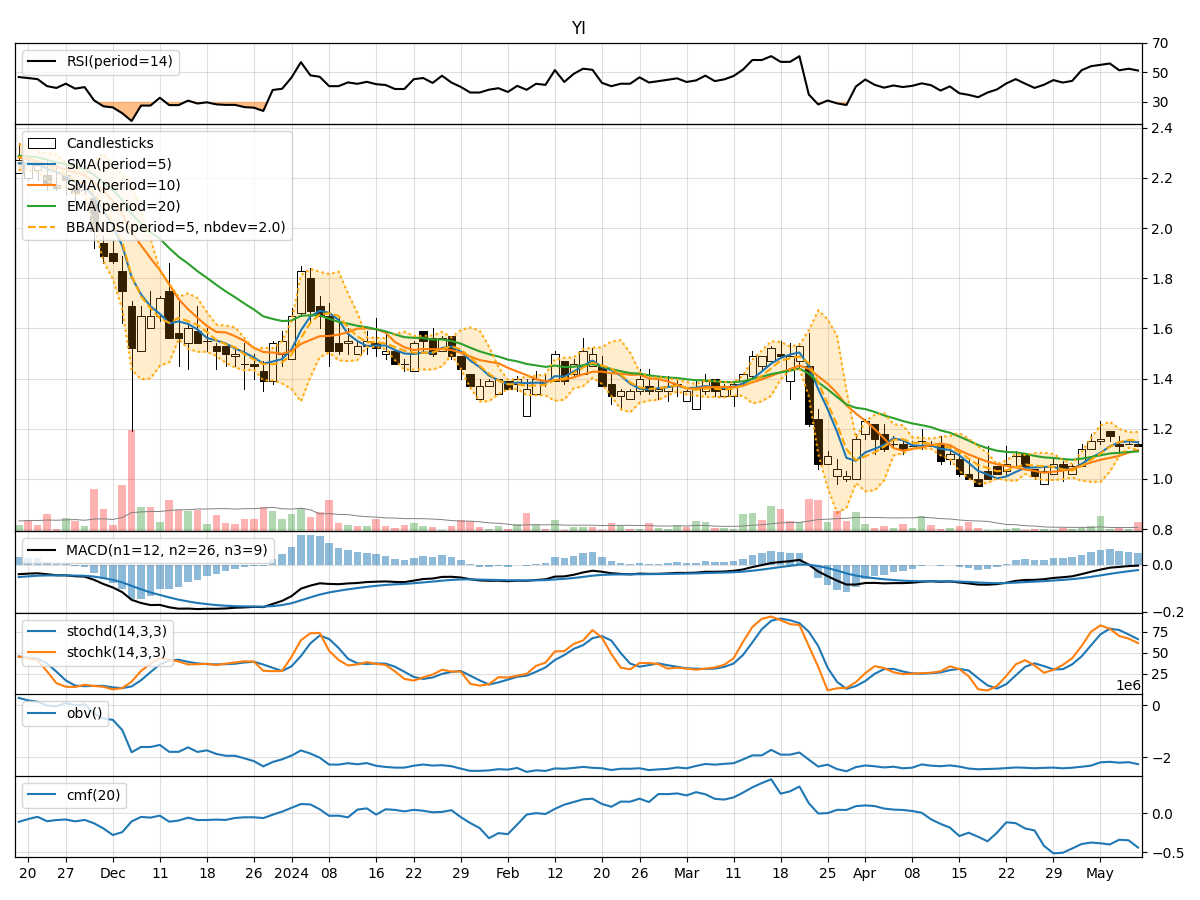
- Moving Averages (MA): The 5-day MA has been consistently above the closing prices, indicating a short-term uptrend.
- MACD: The MACD line has been negative but converging towards the signal line, suggesting a potential reversal in the downtrend.
- EMA: The EMA has been gradually increasing, reflecting a bullish sentiment in the longer term.
Momentum Analysis:
- RSI: The RSI values have been fluctuating around the neutral 50 level, indicating a lack of strong momentum in either direction.
- Stochastic Oscillator: Both %K and %D have been declining, signaling a potential bearish momentum.
- Williams %R: The indicator has been consistently in the oversold territory, suggesting a possible reversal to the upside.
Volatility Analysis:
- Bollinger Bands (BB): The bands have been narrowing, indicating decreasing volatility and a potential breakout in the near future.
- BB %B: The %B indicator has been hovering around the middle range, reflecting a neutral stance in terms of volatility.
Volume Analysis:
- On-Balance Volume (OBV): The OBV has been fluctuating, indicating indecision among market participants.
- Chaikin Money Flow (CMF): The CMF has been negative, suggesting selling pressure in the stock.
Key Observations:
- The trend indicators show a mixed signal with a short-term uptrend but a potential reversal in the longer term.
- Momentum indicators suggest a lack of strong momentum and a possible shift towards bearish sentiment.
- Volatility indicators point towards decreasing volatility and a potential breakout.
- Volume indicators reflect indecision among investors and selling pressure in the stock.
Conclusion:
Based on the analysis of the technical indicators, the stock price of YI is likely to experience sideways consolidation in the coming days. The mixed signals from trend, momentum, volatility, and volume indicators indicate a lack of clear direction in the near term. Traders should exercise caution and wait for a clearer trend to emerge before making significant trading decisions.