Technical Analysis of XTKG 2024-05-10
Overview:
In analyzing the technical indicators for XTKG over the last 5 days, we will delve into the trend, momentum, volatility, and volume indicators to provide a comprehensive outlook on the possible stock price movement in the coming days.
Trend Analysis:
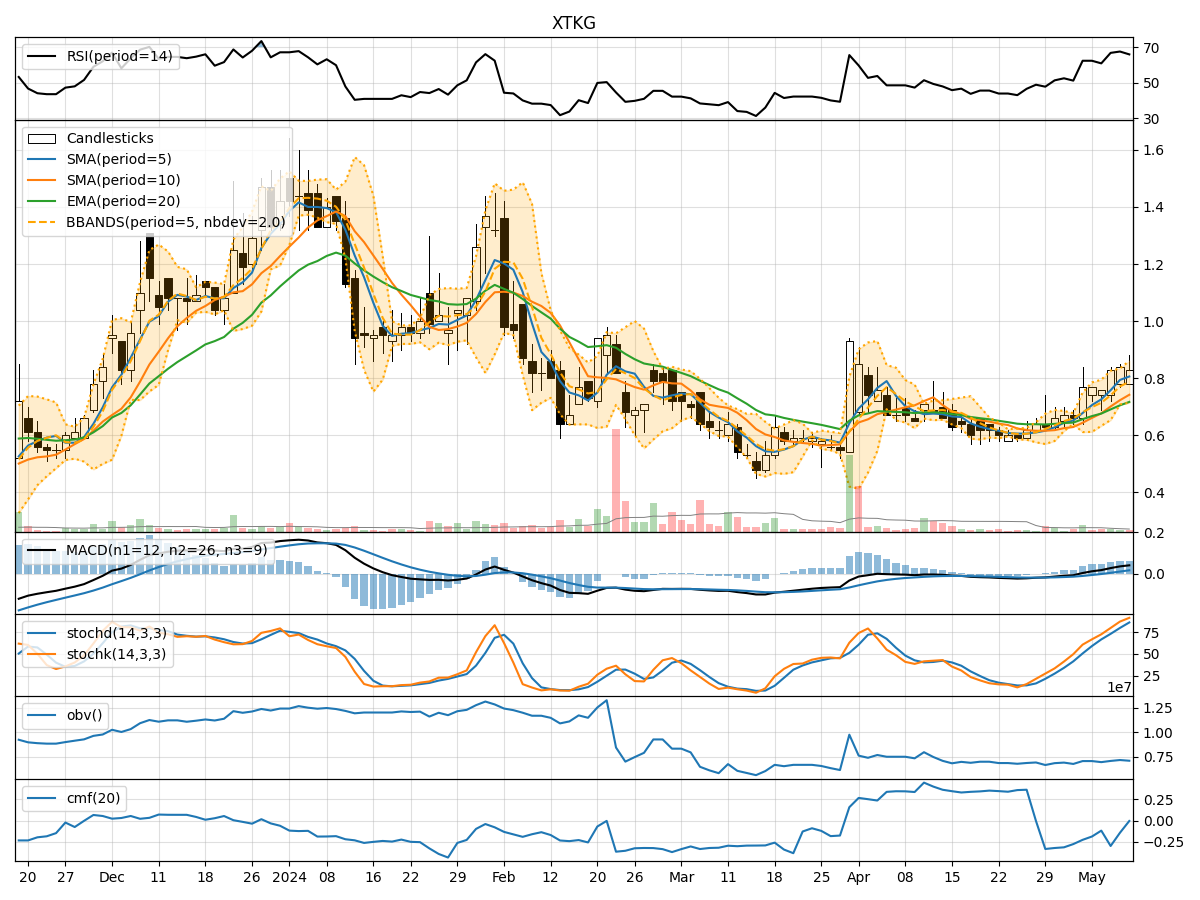
- Moving Averages (MA): The 5-day Moving Average has been consistently above the closing prices, indicating a bullish trend.
- MACD: The MACD line has been above the signal line for the past 5 days, suggesting a bullish momentum.
- EMA: The Exponential Moving Average has been steadily increasing, reflecting a positive trend.
Momentum Analysis:
- RSI: The Relative Strength Index has been fluctuating around the overbought territory, indicating strong buying momentum.
- Stochastic Oscillator: Both %K and %D have been in the overbought zone, signaling a strong bullish momentum.
- Williams %R: The indicator has been hovering in the oversold region, suggesting a potential reversal.
Volatility Analysis:
- Bollinger Bands: The stock price has been trading within the upper and lower bands, indicating moderate volatility.
- Bollinger %B: The %B indicator has been fluctuating within a reasonable range, reflecting stable price movement.
Volume Analysis:
- On-Balance Volume (OBV): The OBV has been showing a slight decrease, indicating some distribution happening in the stock.
- Chaikin Money Flow (CMF): The CMF has been negative, suggesting outflow of money from the stock.
Key Observations:
- The trend indicators suggest a strong bullish sentiment with moving averages and MACD signaling an upward trend.
- Momentum indicators indicate a strong buying momentum with RSI and Stochastic Oscillator in the overbought zone.
- Volatility remains moderate with the stock price trading within the Bollinger Bands.
- Volume indicators show a slight decrease in OBV and negative CMF, indicating some selling pressure.
Conclusion:
Based on the analysis of the technical indicators, the stock is likely to continue its upward movement in the coming days. The strong bullish trend, supported by positive momentum and moderate volatility, suggests that the stock price may experience further gains. However, investors should closely monitor the volume indicators for any signs of a potential trend reversal. Overall, the outlook for XTKG appears bullish in the near term.