Technical Analysis of XRTX 2024-05-10
Overview:
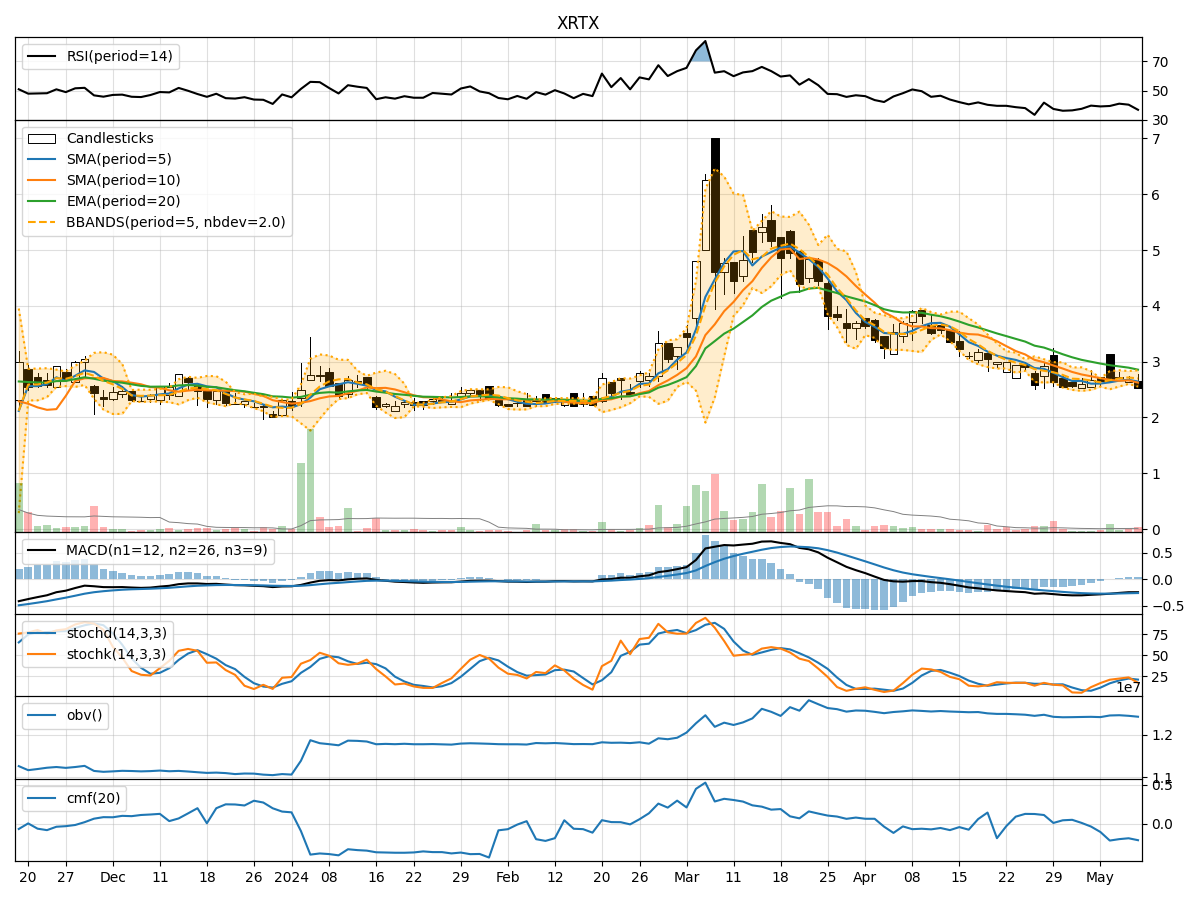
In analyzing the technical indicators for XRTX over the last 5 days, we will delve into the trend, momentum, volatility, and volume indicators to provide a comprehensive outlook on the possible stock price movement in the coming days.
Trend Indicators:
- Moving Averages (MA): The 5-day MA has been fluctuating around the closing prices, indicating short-term price trends. The SMA(10) and EMA(20) show a downward trend, suggesting a bearish sentiment in the medium to long term.
- MACD: The MACD line has been consistently below the signal line, indicating a bearish trend in momentum.
- MACD Histogram: The MACD histogram has been hovering around the zero line, suggesting a lack of strong momentum in either direction.
Momentum Indicators:
- RSI: The RSI has been fluctuating in the neutral zone, indicating indecision in the market.
- Stochastic Oscillator: Both %K and %D have been moving within a range, showing a lack of clear direction in momentum.
- Williams %R: The indicator has been in the oversold territory, suggesting a potential reversal in price.
Volatility Indicators:
- Bollinger Bands: The bands have been narrowing, indicating decreasing volatility in the stock price.
- Bollinger %B: The %B indicator has been fluctuating around the middle line, reflecting a lack of extreme price movements.
Volume Indicators:
- On-Balance Volume (OBV): The OBV has been relatively stable, indicating a balance between buying and selling pressure.
- Chaikin Money Flow (CMF): The CMF has been negative, suggesting a net outflow of money from the stock.
Key Observations:
- The trend indicators show a bearish sentiment in the medium to long term.
- Momentum indicators reflect indecision and lack of strong directional momentum.
- Volatility indicators point towards decreasing volatility in the stock price.
- Volume indicators indicate a balance between buying and selling pressure with a slight negative bias.
Conclusion:
Based on the analysis of the technical indicators, the stock price of XRTX is likely to experience further downward movement in the coming days. The bearish trend in the moving averages, MACD, and RSI, coupled with decreasing volatility and negative CMF, suggest a continued bearish outlook. Traders and investors should exercise caution and consider shorting or staying on the sidelines until a clear reversal pattern emerges.
Disclaimer:
This analysis is based solely on technical indicators and historical data. It is essential to consider other fundamental factors and market dynamics before making any investment decisions. Consulting with a financial advisor for personalized advice is recommended.