Technical Analysis of WTO 2024-05-10
Overview:
In analyzing the technical indicators for WTO stock over the last 5 days, we will delve into the trend, momentum, volatility, and volume indicators to provide a comprehensive outlook on the possible stock price movement in the coming days. By examining these key indicators, we aim to offer valuable insights and predictions to guide investment decisions.
Trend Analysis:
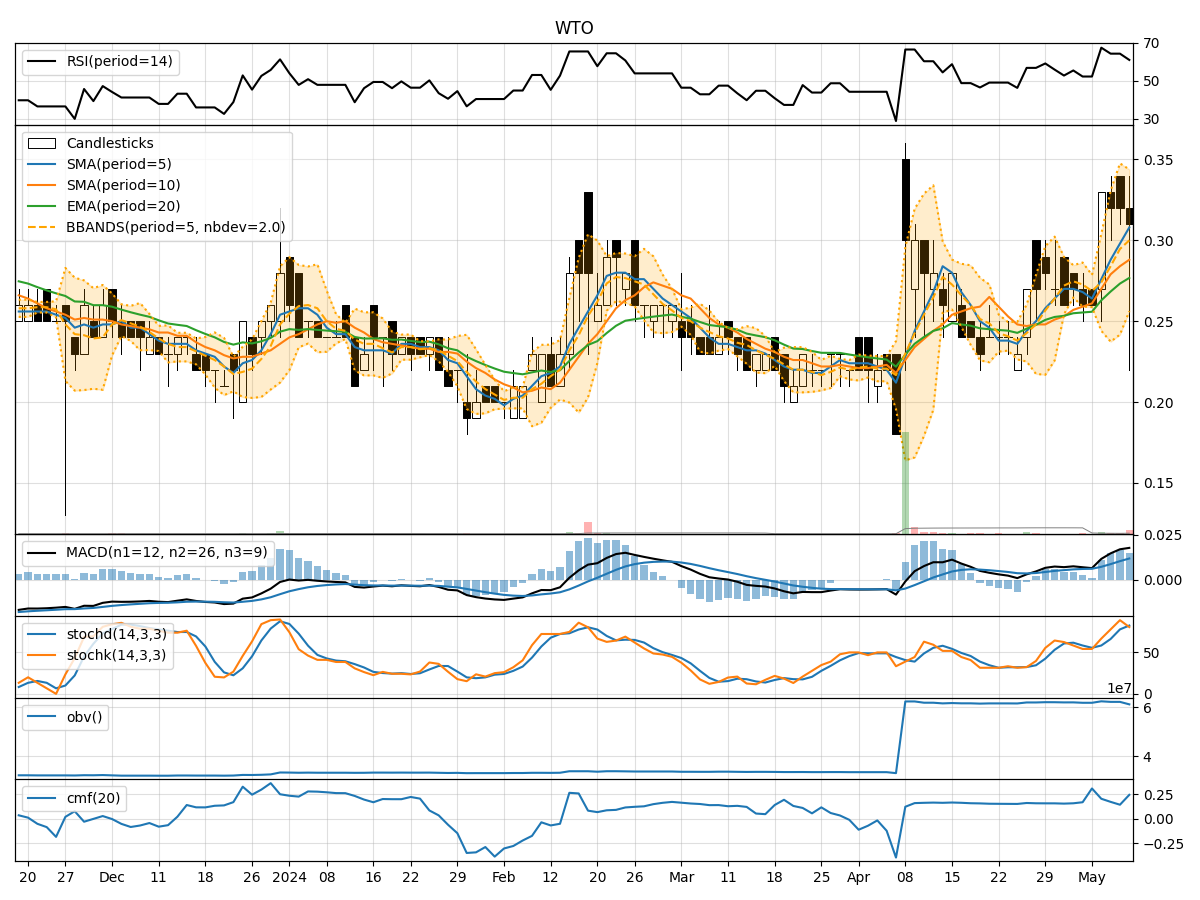
- Moving Averages (MA): The 5-day moving average has been showing an upward trend, indicating a positive momentum in the stock price.
- MACD (Moving Average Convergence Divergence): The MACD line has been consistently above the signal line, suggesting a bullish trend in the stock.
- EMA (Exponential Moving Average): The EMA has been steadily increasing, further supporting the bullish sentiment in the stock.
Momentum Analysis:
- RSI (Relative Strength Index): The RSI has been fluctuating in the overbought territory, indicating strong buying momentum in the stock.
- Stochastic Oscillator: Both %K and %D lines of the stochastic oscillator have been in the overbought zone, signaling a potential reversal or consolidation in the stock price.
- Williams %R (Willams Percentage Range): The Williams %R has been consistently in the oversold region, suggesting a possible reversal in the stock price.
Volatility Analysis:
- Bollinger Bands: The Bollinger Bands have been widening, indicating increased volatility in the stock price.
- Bollinger %B: The %B indicator has been fluctuating, reflecting the volatility in the stock price movements.
Volume Analysis:
- On-Balance Volume (OBV): The OBV indicator has been relatively stable, suggesting a balance between buying and selling pressure in the stock.
- Chaikin Money Flow (CMF): The CMF has been fluctuating, indicating a mixed sentiment among investors regarding the stock.
Key Observations and Opinions:
- Trend: The stock is currently in an upward trend based on moving averages and MACD analysis.
- Momentum: The momentum indicators suggest a strong buying sentiment in the stock, but the stochastic oscillator signals a potential reversal due to overbought conditions.
- Volatility: The widening Bollinger Bands indicate increased volatility in the stock price.
- Volume: The volume indicators show a balanced buying and selling pressure in the stock.
Conclusion:
Based on the analysis of the technical indicators, the next few days' possible stock price movement for WTO stock is likely to be upward with some volatility due to the mixed signals from momentum indicators. Investors should closely monitor the stochastic oscillator for any signs of a reversal and consider the increasing volatility in their trading strategies. Overall, the bullish trend supported by moving averages and MACD suggests a positive outlook for the stock in the near term.