Technical Analysis of WRNT 2024-05-10
Overview:
In analyzing the technical indicators for WRNT over the last 5 days, we will delve into the trend, momentum, volatility, and volume indicators to provide a comprehensive outlook on the possible stock price movement. By examining these key aspects, we aim to offer valuable insights and predictions for the upcoming days.
Trend Analysis:
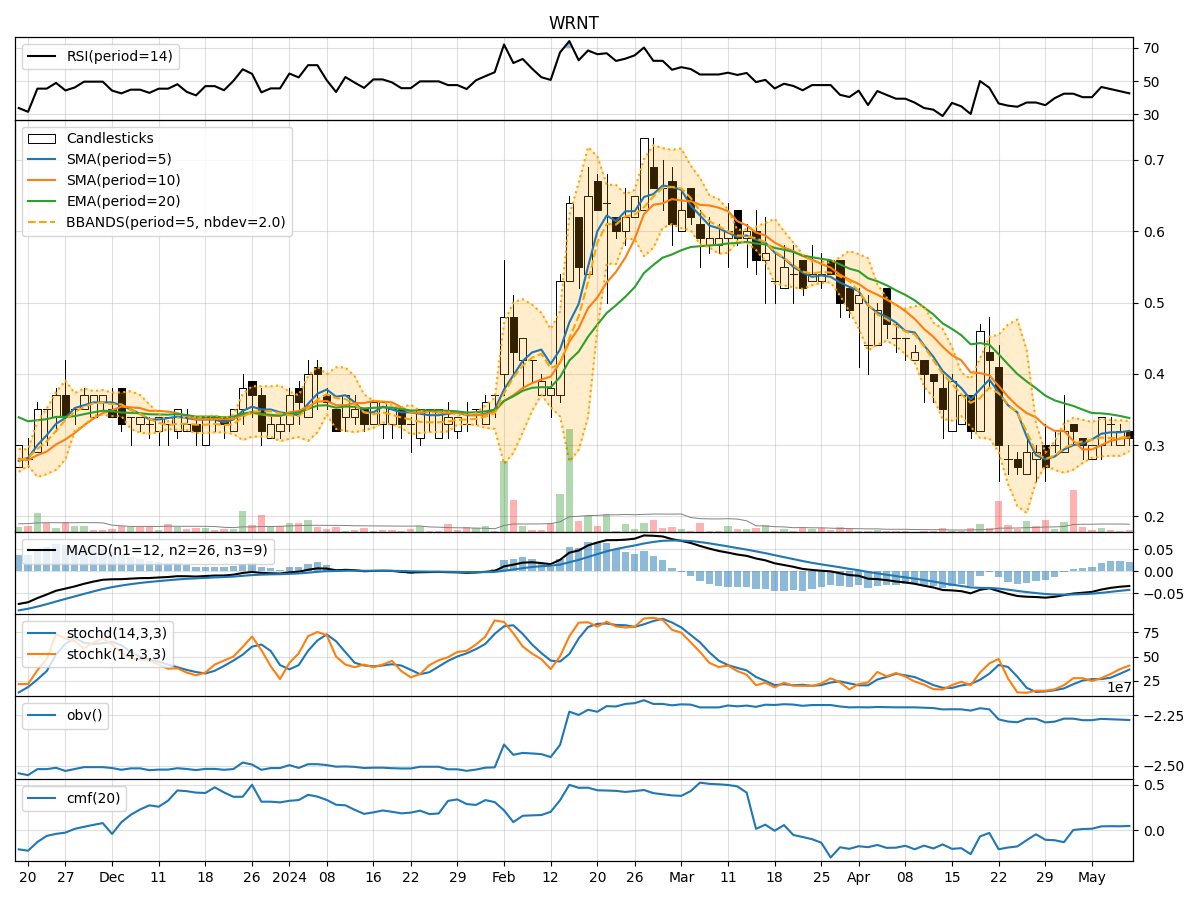
- Moving Averages (MA): The 5-day MA has been fluctuating around the closing prices, indicating a short-term trend. The SMA(10) and EMA(20) show a downward trend, suggesting a bearish sentiment in the medium to long term.
- MACD: The MACD line has been consistently negative, with the MACD histogram showing a slight increase, indicating a potential reversal in the bearish momentum.
Momentum Analysis:
- RSI: The RSI has been hovering around the oversold region, indicating a bearish momentum in the stock.
- Stochastic Oscillator: Both %K and %D have been rising, suggesting a potential bullish momentum in the near future.
- Williams %R: The indicator has been moving towards the oversold region, signaling a potential reversal in the downward momentum.
Volatility Analysis:
- Bollinger Bands (BB): The bands have been narrowing, indicating decreasing volatility in the stock price.
- Bollinger %B: The %B has been decreasing, suggesting a potential consolidation phase in the stock.
Volume Analysis:
- On-Balance Volume (OBV): The OBV has been relatively stable, indicating a balance between buying and selling pressure.
- Chaikin Money Flow (CMF): The CMF has been positive, indicating a bullish money flow into the stock.
Key Observations:
- The trend indicators suggest a bearish sentiment in the medium to long term.
- Momentum indicators show mixed signals, with RSI indicating bearish momentum and Stochastic Oscillator hinting at a potential bullish reversal.
- Volatility indicators point towards decreasing volatility and a possible consolidation phase.
- Volume indicators reflect a balanced buying and selling pressure with a positive money flow into the stock.
Conclusion:
Based on the analysis of the technical indicators, the next few days' possible stock price movement for WRNT could be sideways with a slight bullish bias. While the trend indicators signal a bearish sentiment in the medium to long term, the momentum indicators show conflicting signals with a potential bullish reversal. The decreasing volatility and balanced volume indicators further support a sideways movement with a slight upward bias. Traders should closely monitor the momentum indicators for confirmation of a bullish reversal and consider the overall market conditions before making any trading decisions.