Technical Analysis of WKSP 2024-05-10
Overview:
In analyzing the technical indicators for WKSP over the last 5 days, we will delve into the trend, momentum, volatility, and volume indicators to provide a comprehensive outlook on the possible stock price movement in the coming days. By examining these key indicators, we aim to offer valuable insights and predictions for informed decision-making.
Trend Analysis:
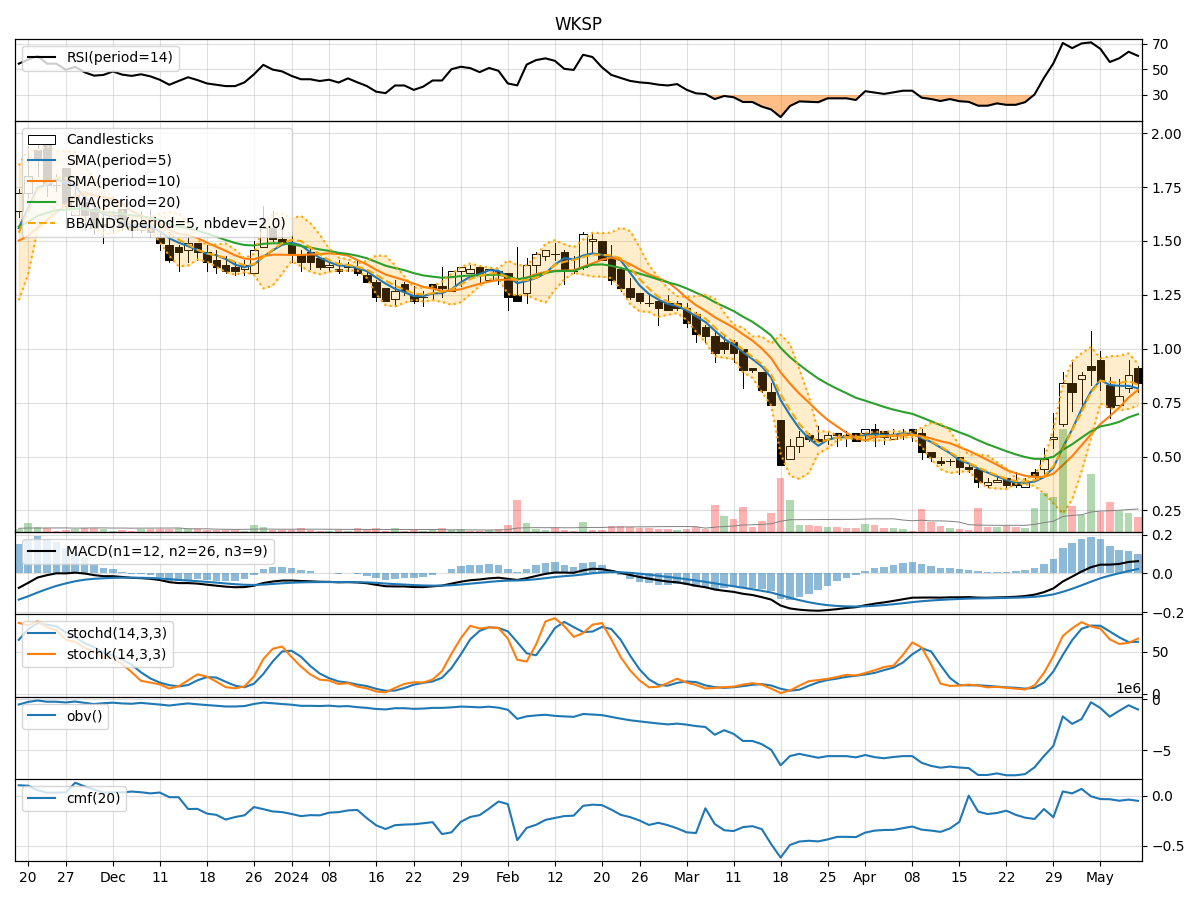
- Moving Averages (MA): The 5-day MA has been fluctuating around the stock price, indicating short-term price trends. The SMA(10) and EMA(20) have shown an upward trend, suggesting a positive momentum in the stock price.
- MACD: The MACD line has been consistently positive, indicating a bullish trend. The MACD Histogram has been increasing, showing strengthening bullish momentum.
Momentum Analysis:
- RSI: The RSI has been fluctuating but generally staying above 50, indicating a bullish momentum in the stock.
- Stochastic Oscillator: Both %K and %D have been in the overbought zone, suggesting a potential reversal or consolidation in the stock price.
- Williams %R: The Williams %R has been fluctuating in the oversold and overbought zones, indicating potential price reversals.
Volatility Analysis:
- Bollinger Bands (BB): The stock price has been trading within the bands, with the %B indicator fluctuating around the midline. This suggests a period of consolidation or sideways movement.
- Average True Range (ATR): The ATR has been relatively stable, indicating consistent price volatility.
Volume Analysis:
- On-Balance Volume (OBV): The OBV has shown mixed signals, with fluctuations in volume accumulation. This could indicate indecision among investors.
- Chaikin Money Flow (CMF): The CMF has been negative, suggesting selling pressure in the stock.
Conclusion:
Based on the analysis of the technical indicators, the stock of WKSP is currently exhibiting a mixed outlook. While the trend indicators show a bullish sentiment with positive moving averages and MACD, the momentum indicators suggest a potential reversal or consolidation due to overbought conditions in the stochastic oscillator.
The volatility indicators point towards a period of consolidation or sideways movement, supported by the Bollinger Bands and ATR. The volume indicators also indicate indecision among investors, with mixed signals from OBV and CMF.
Overall Assessment:
- Short-Term Outlook: The stock may experience some consolidation or a minor pullback in the short term due to overbought conditions and mixed volume signals.
- Long-Term Outlook: The bullish trend indicated by moving averages and MACD suggests a positive long-term outlook for the stock.
Recommendation:
- Short-Term: Consolidation or Minor Pullback
- Long-Term: Bullish
Key Takeaway:
Investors should closely monitor the stock price for potential entry points during consolidation phases and consider the long-term bullish trend for strategic investment decisions.