Technical Analysis of WILC 2024-05-10
Overview:
In analyzing the technical indicators for WILC over the last 5 days, we will delve into the trend, momentum, volatility, and volume indicators to provide a comprehensive outlook on the possible stock price movement in the coming days. By examining these key indicators, we aim to offer valuable insights and predictions for informed decision-making.
Trend Analysis:
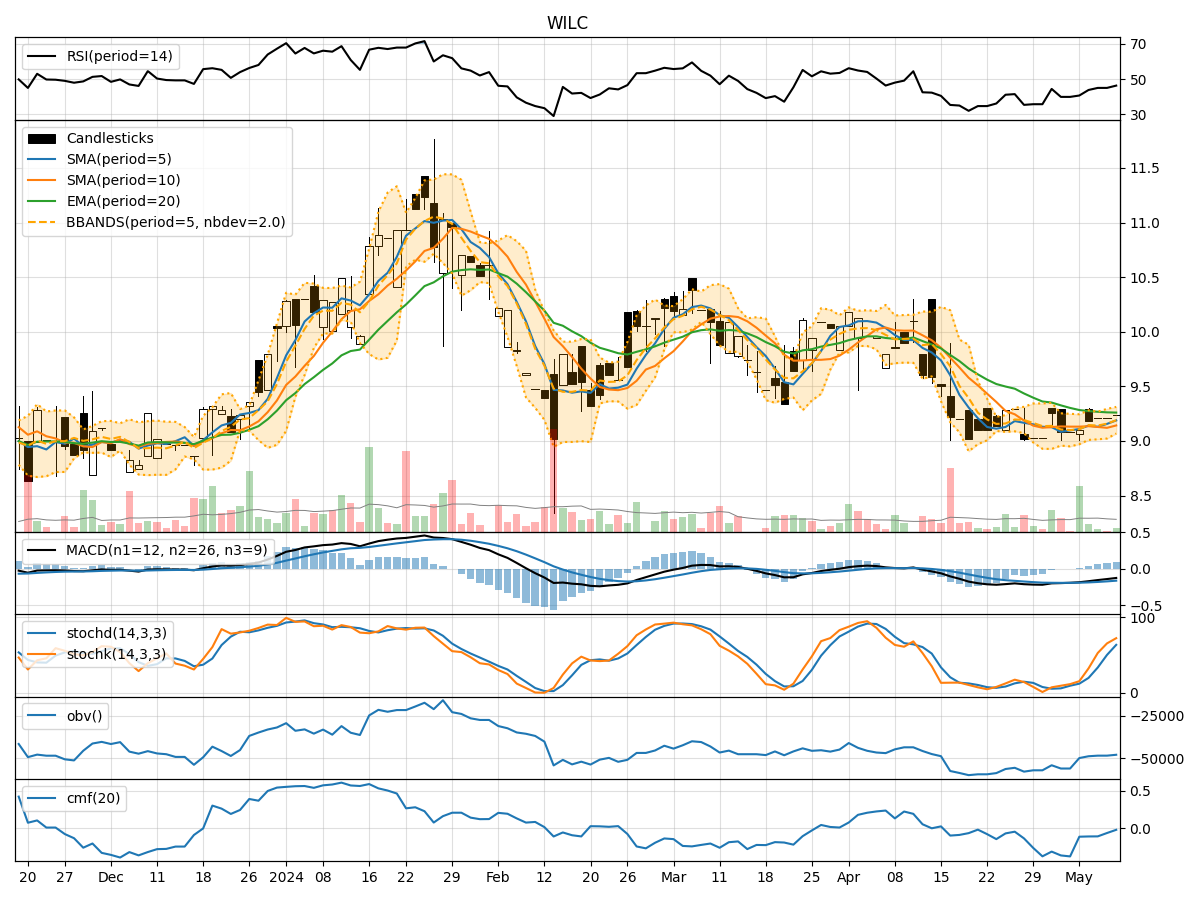
- Moving Averages (MA): The 5-day MA has been fluctuating around the closing prices, indicating short-term price trends. The SMA(10) and EMA(20) show a slight downward trend, suggesting a potential bearish sentiment.
- MACD and Signal Line: The MACD has been negative, with the MACD line consistently below the signal line. This indicates a bearish momentum in the stock price.
Momentum Analysis:
- RSI: The RSI has been gradually increasing but remains below the overbought threshold of 70. This suggests a neutral to slightly bullish momentum.
- Stochastic Oscillator: Both %K and %D have been rising, indicating increasing buying pressure. However, %K is approaching the overbought zone, signaling a potential reversal.
Volatility Analysis:
- Bollinger Bands (BB): The stock price has been trading within the bands, with the BB width narrowing. This suggests decreasing volatility and a possible period of consolidation.
Volume Analysis:
- On-Balance Volume (OBV): The OBV has been fluctuating but generally trending downwards, indicating selling pressure in the stock.
- Chaikin Money Flow (CMF): The CMF has been negative, reflecting a lack of buying interest in the stock.
Key Observations:
- The trend indicators point towards a bearish sentiment, with moving averages and MACD signaling a potential downward trend.
- Momentum indicators show a mixed picture, with RSI indicating a neutral to slightly bullish momentum, while stochastic oscillators suggest a possible overbought scenario.
- Volatility indicators indicate decreasing volatility and a period of consolidation.
- Volume indicators reflect selling pressure and a lack of significant buying interest in the stock.
Conclusion:
Based on the analysis of the technical indicators, the overall outlook for WILC in the next few days leans towards a bearish sentiment. The trend indicators, supported by the momentum indicators, suggest a potential downward movement in the stock price. The decreasing volatility and lack of significant buying interest further reinforce this bearish view. Traders and investors should exercise caution and consider potential short positions or staying on the sidelines until a clearer trend emerges.
Disclaimer:
This analysis is based solely on technical indicators and historical data, and it is important to consider other fundamental factors and market dynamics before making any investment decisions. Market conditions can change rapidly, and it is advisable to conduct thorough research or consult with a financial advisor before taking any trading actions.