Technical Analysis of VRSN 2024-05-10
Overview:
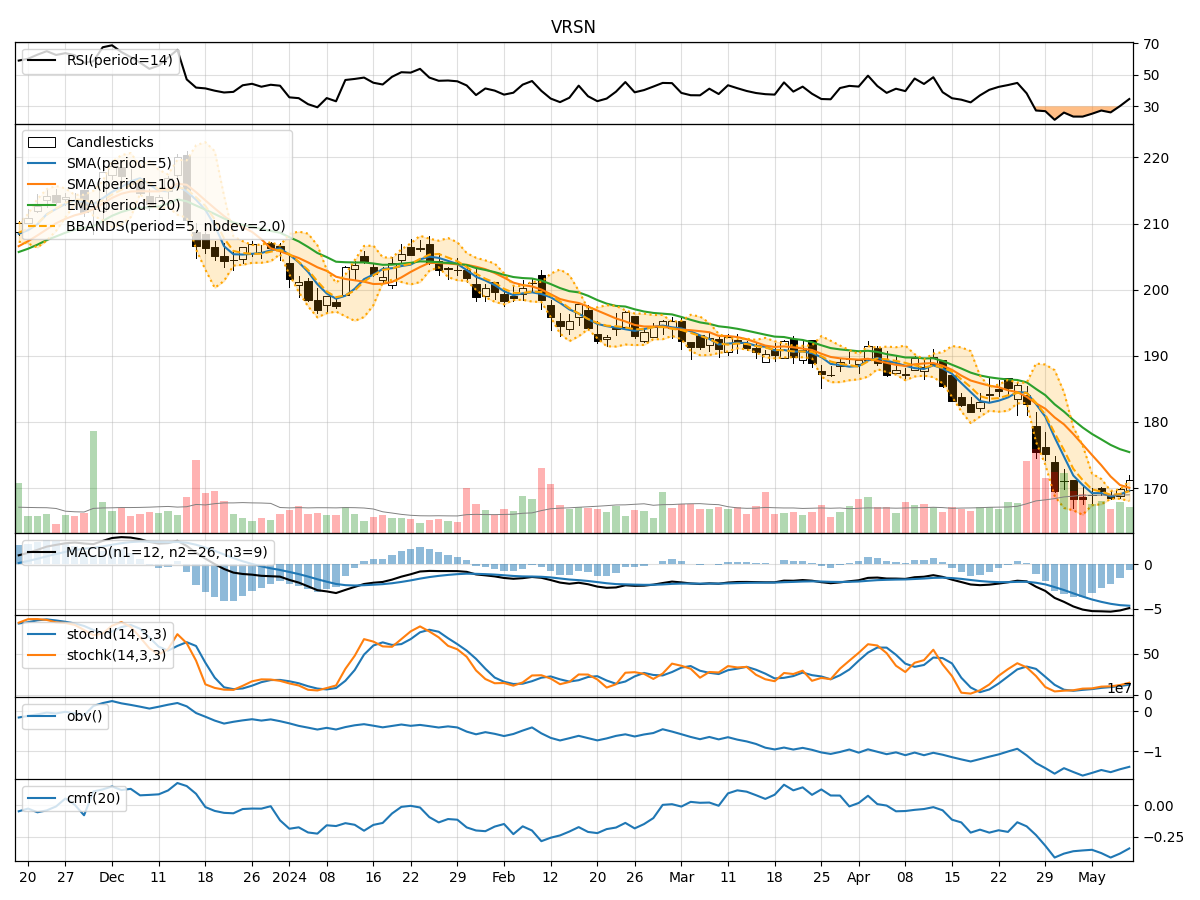
In analyzing the technical indicators for Verisign Inc. (VRSN) over the last 5 days, we will delve into the trend, momentum, volatility, and volume indicators to provide insights into the possible future stock price movement. By examining these indicators, we aim to offer a comprehensive analysis and make informed predictions for the upcoming trading days.
Trend Indicators:
- Moving Averages (MA): The 5-day MA is below both the 10-day SMA and the 20-day EMA, indicating a short-term bearish trend.
- MACD: The MACD line is below the signal line, suggesting a bearish momentum in the stock price.
- MACD Histogram: The MACD histogram is negative, further supporting the bearish sentiment in the stock.
Momentum Indicators:
- RSI: The RSI is below 50, indicating a bearish momentum in the stock.
- Stochastic Oscillator: Both %K and %D lines are below 20, signaling an oversold condition.
- Williams %R: The Williams %R is below -80, indicating that the stock is in oversold territory.
Volatility Indicators:
- Bollinger Bands: The stock price is currently trading below the lower Bollinger Band, suggesting an oversold condition.
- Bollinger %B: The %B is below 0.2, indicating that the stock is oversold.
- Bollinger Band Width: The Band Width is expanding, indicating increased volatility in the stock price.
Volume Indicators:
- On-Balance Volume (OBV): The OBV is showing a downtrend, indicating selling pressure in the stock.
- Chaikin Money Flow (CMF): The CMF is negative, suggesting that money is flowing out of the stock.
Key Observations and Opinions:
- Trend: The trend indicators suggest a bearish sentiment in the stock price.
- Momentum: Momentum indicators confirm the bearish momentum and oversold conditions.
- Volatility: Volatility indicators show increased volatility and an oversold condition.
- Volume: Volume indicators indicate selling pressure and negative money flow.
Conclusion:
Based on the analysis of the technical indicators, the next few days' possible stock price movement for VRSN is likely to continue in a downward direction. The bearish trend, negative momentum, oversold conditions, increased volatility, and selling pressure all point towards a potential further decline in the stock price. Traders and investors should exercise caution and consider waiting for signs of a reversal before considering any long positions.