Technical Analysis of VRAX 2024-05-10
Overview:
In analyzing the technical indicators for VRAX over the last 5 days, we will delve into the trend, momentum, volatility, and volume indicators to provide a comprehensive outlook on the possible stock price movement in the coming days. By examining these key aspects, we aim to offer valuable insights and predictions to guide your investment decisions.
Trend Analysis:
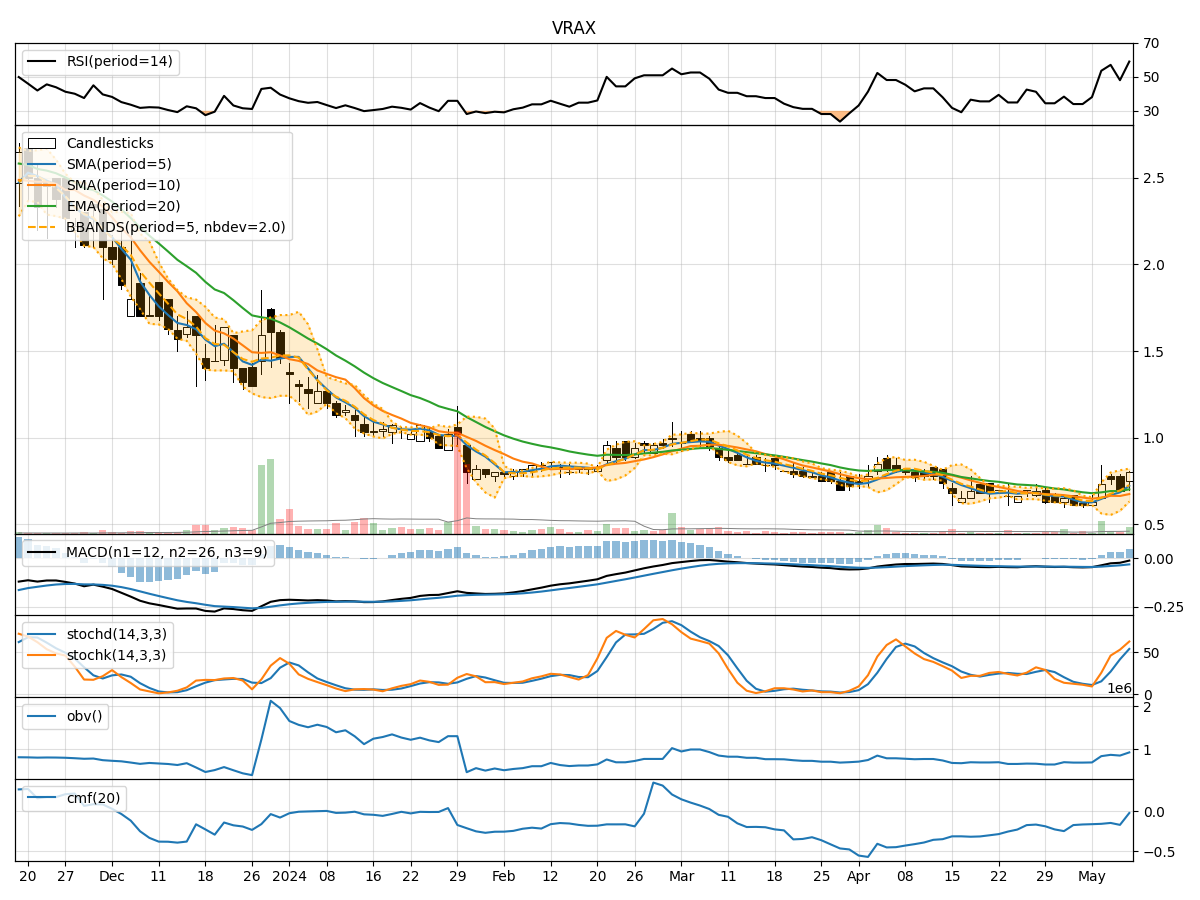
- Moving Averages (MA): The 5-day Moving Average (MA) has been showing an upward trend, indicating a positive momentum in the stock price.
- MACD: The Moving Average Convergence Divergence (MACD) has been gradually increasing, suggesting a strengthening bullish momentum.
Momentum Analysis:
- RSI: The Relative Strength Index (RSI) has been fluctuating but is currently in the neutral zone, indicating a balanced momentum.
- Stochastic Oscillator: The Stochastic Oscillator shows an upward trend, signifying a potential bullish momentum.
Volatility Analysis:
- Bollinger Bands (BB): The Bollinger Bands have been widening, indicating increased volatility in the stock price.
Volume Analysis:
- On-Balance Volume (OBV): The OBV has been fluctuating but is showing an overall positive trend, suggesting accumulation by investors.
- Chaikin Money Flow (CMF): The CMF has been negative, indicating some selling pressure in the stock.
Key Observations:
- The trend indicators suggest a bullish sentiment with the moving averages and MACD pointing towards an upward trajectory.
- Momentum indicators show a mixed signal with RSI in a neutral position but Stochastic Oscillator indicating a potential bullish momentum.
- Volatility has increased as seen in the widening Bollinger Bands, which could lead to significant price movements.
- Volume indicators reflect a positive accumulation trend with OBV showing overall buying pressure despite some selling indicated by CMF.
Conclusion:
Based on the analysis of the technical indicators, the overall outlook for VRAX in the next few days is bullish. The trend indicators, supported by the momentum indicators, suggest a potential upward movement in the stock price. The increased volatility could lead to significant price swings, offering trading opportunities for investors. The positive accumulation trend in volume indicators further supports the bullish view. Therefore, it is likely that VRAX will experience an upward price movement in the coming days.